PROTECTED SOURCE SCRIPT
Investment Bottom Indicator
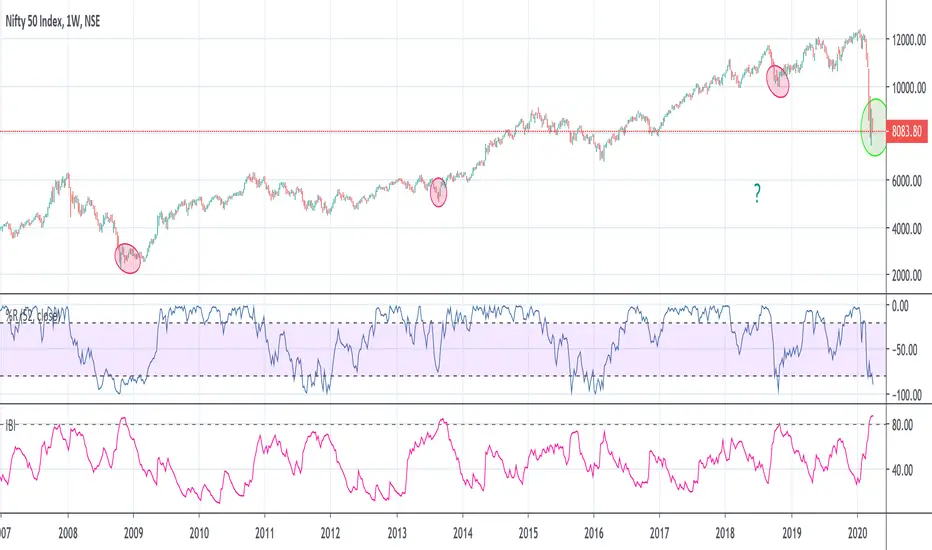
Want to know when the market has reached near bottom in selloff or bearish trend?
You now have a perfect indicator for that - "Investment Bottom Indicator"
How to use?
Chart Setup-
Step 1- Add your index symbol
Step 2- Change the time frame to weekly (candle sticks)
Step 3- Add William %R - settings: Period- 52, Close
Step 4- Add this indicator - Investment Bottom Indicator
Analysis-
When the William %R value is below -80 & Investment Bottom Indicator value is above 80 : this indicates that the market is near its bottom and if you have not yet started investing yet, this is the right time before the market flies off (in very few weeks/months) & you miss the bus!
보호된 스크립트입니다
이 스크립트는 비공개 소스로 게시됩니다. 하지만 이를 자유롭게 제한 없이 사용할 수 있습니다 – 자세한 내용은 여기에서 확인하세요.
면책사항
해당 정보와 게시물은 금융, 투자, 트레이딩 또는 기타 유형의 조언이나 권장 사항으로 간주되지 않으며, 트레이딩뷰에서 제공하거나 보증하는 것이 아닙니다. 자세한 내용은 이용 약관을 참조하세요.
면책사항
해당 정보와 게시물은 금융, 투자, 트레이딩 또는 기타 유형의 조언이나 권장 사항으로 간주되지 않으며, 트레이딩뷰에서 제공하거나 보증하는 것이 아닙니다. 자세한 내용은 이용 약관을 참조하세요.