OPEN-SOURCE SCRIPT
업데이트됨 Reversal
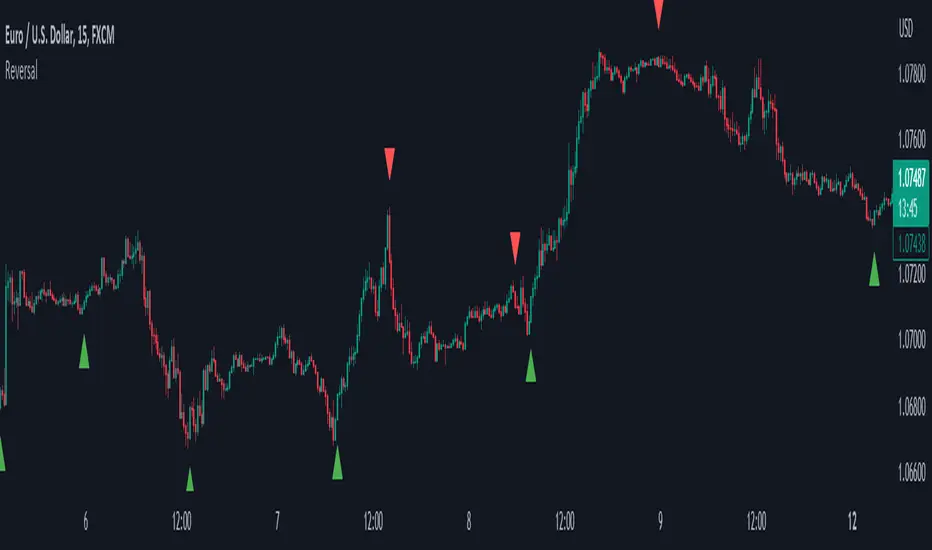
The primary objective of this indicator is to discern candles that exhibit characteristics suggestive of potential market reversals through the application of candlestick analysis. Extensive observation across various assets and timeframes has revealed the existence of a recurrent reversal pattern. This pattern typically manifests as a sequence of one to three candles that abruptly diverge from the prevailing price action or trend, offering a distinctive signal indicating a potential reversal.
By leveraging the insights gained from this observation, the indicator aims to assist traders in identifying these noteworthy candle patterns that hold the potential to indicate significant market shifts.
The indicator operates as follows: initially, it identifies the lowest close (in the case of a bullish reversal) or the highest close (in the case of a bearish reversal) within a specified number of previous candles, as determined by user input (referred to as "Candle Lookback").

Next, the indicator examines whether the closing price surpasses the high of the previously identified lowest (bullish reversal) or highest (bearish reversal) closed candle within a designated number of candles, as specified by the user (referred to as "Confirm Within").

By leveraging the insights gained from this observation, the indicator aims to assist traders in identifying these noteworthy candle patterns that hold the potential to indicate significant market shifts.
The indicator operates as follows: initially, it identifies the lowest close (in the case of a bullish reversal) or the highest close (in the case of a bearish reversal) within a specified number of previous candles, as determined by user input (referred to as "Candle Lookback").
Next, the indicator examines whether the closing price surpasses the high of the previously identified lowest (bullish reversal) or highest (bearish reversal) closed candle within a designated number of candles, as specified by the user (referred to as "Confirm Within").
릴리즈 노트
Now "Reversal" signals have two modes:> Repainting Mode:
- Signal based on real-time candle without any delay.
> Non-Repainting mode:
- Signal based on confirmed candles, thus with slight delay.
오픈 소스 스크립트
트레이딩뷰의 진정한 정신에 따라, 이 스크립트의 작성자는 이를 오픈소스로 공개하여 트레이더들이 기능을 검토하고 검증할 수 있도록 했습니다. 작성자에게 찬사를 보냅니다! 이 코드는 무료로 사용할 수 있지만, 코드를 재게시하는 경우 하우스 룰이 적용된다는 점을 기억하세요.
면책사항
해당 정보와 게시물은 금융, 투자, 트레이딩 또는 기타 유형의 조언이나 권장 사항으로 간주되지 않으며, 트레이딩뷰에서 제공하거나 보증하는 것이 아닙니다. 자세한 내용은 이용 약관을 참조하세요.
오픈 소스 스크립트
트레이딩뷰의 진정한 정신에 따라, 이 스크립트의 작성자는 이를 오픈소스로 공개하여 트레이더들이 기능을 검토하고 검증할 수 있도록 했습니다. 작성자에게 찬사를 보냅니다! 이 코드는 무료로 사용할 수 있지만, 코드를 재게시하는 경우 하우스 룰이 적용된다는 점을 기억하세요.
면책사항
해당 정보와 게시물은 금융, 투자, 트레이딩 또는 기타 유형의 조언이나 권장 사항으로 간주되지 않으며, 트레이딩뷰에서 제공하거나 보증하는 것이 아닙니다. 자세한 내용은 이용 약관을 참조하세요.