PROTECTED SOURCE SCRIPT
업데이트됨 PVA Volume
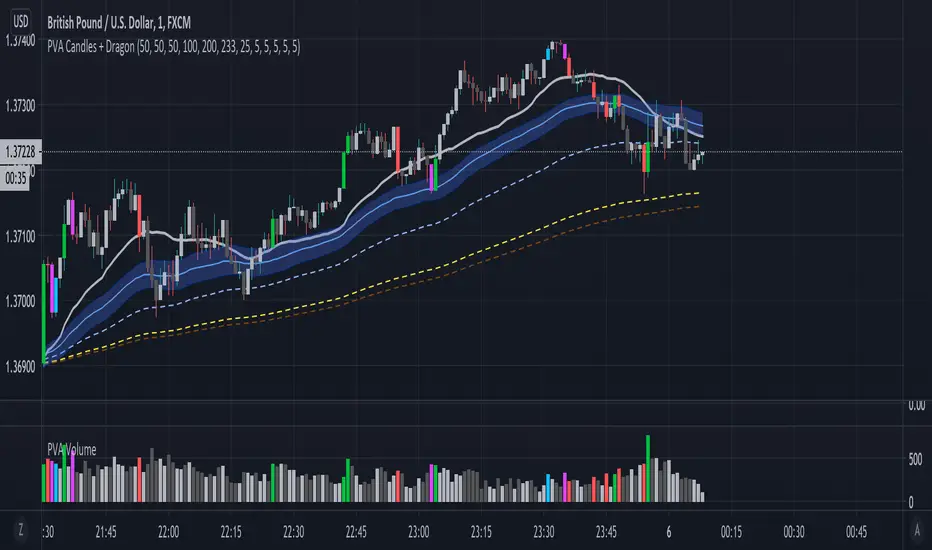
The PVA volume is part of PVSRA and it shows different bar colors according to the conditions below.
Situation "Climax". When volume >= 200% of the average volume of the 10
previous chart candles or where the product of candle spread x candle volume is >= the
highest for the 10 previous chart candles. Default Colors: Bullish bars are green and
Bearish bars are red.
Situation "Volume Rising Above Average". When volume >= 150% of the average
volume of the 10 previous chart candles. Default Colors: Bullish bars are blue and bearish bars are
blue-violet.
릴리즈 노트
I changed the transparency to zero so that the volume bar becomes more visible and so that it resembles the original PVSRA script.보호된 스크립트입니다
이 스크립트는 비공개 소스로 게시됩니다. 하지만 이를 자유롭게 제한 없이 사용할 수 있습니다 – 자세한 내용은 여기에서 확인하세요.
면책사항
해당 정보와 게시물은 금융, 투자, 트레이딩 또는 기타 유형의 조언이나 권장 사항으로 간주되지 않으며, 트레이딩뷰에서 제공하거나 보증하는 것이 아닙니다. 자세한 내용은 이용 약관을 참조하세요.
면책사항
해당 정보와 게시물은 금융, 투자, 트레이딩 또는 기타 유형의 조언이나 권장 사항으로 간주되지 않으며, 트레이딩뷰에서 제공하거나 보증하는 것이 아닙니다. 자세한 내용은 이용 약관을 참조하세요.