OPEN-SOURCE SCRIPT
Weighted Moving Average Indicator (WMAI) 50/100/200 SMA + 21 EMA
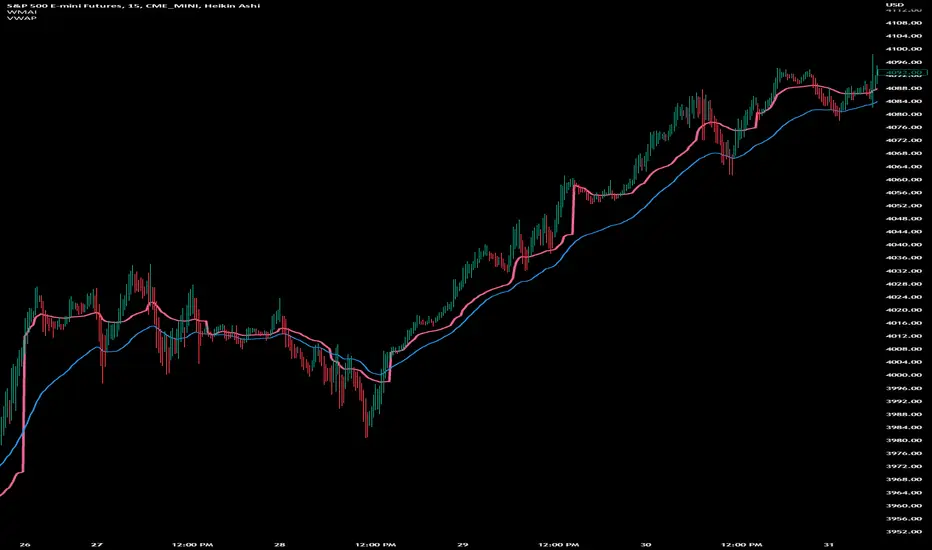
The Weighted Moving Average Indicator (WMAI) is a custom technical analysis tool that combines the information from three Simple Moving Averages (SMA) and one Exponential Moving Average (EMA) to create a single line on the chart. This line can be used to identify trends, potential entry and exit points, and overall market direction. Here's how to use this indicator:
Identifying trends: When the WMAI line is moving upwards, it signals a bullish trend, meaning that the asset's price is generally increasing. Conversely, when the WMAI line is moving downwards, it signals a bearish trend, indicating that the asset's price is generally decreasing. A flat WMAI line suggests a sideways or consolidating market.
Potential entry and exit points: You can use the WMAI line in combination with the asset's price or other technical indicators to identify potential entry and exit points for trades. For example, when the price crosses above the WMAI line, it might be considered a buy signal, as it suggests a potential upward trend. Conversely, when the price crosses below the WMAI line, it might be considered a sell signal, indicating a potential downward trend. Keep in mind that, like any other indicator, WMAI is not foolproof and should be used in conjunction with other technical analysis tools and techniques to increase the chances of successful trades.
Support and resistance levels: The WMAI line can act as a dynamic support and resistance level. When the price is above the WMAI line, the line can act as a support level, making it less likely for the price to drop below the line. Conversely, when the price is below the WMAI line, it can act as a resistance level, making it harder for the price to rise above the line.
Confirming signals from other indicators: You can use the WMAI line to confirm signals from other technical analysis tools. For instance, if you use a momentum oscillator like the Relative Strength Index (RSI) to identify overbought or oversold conditions, you can look for confluence with the WMAI line. If the WMAI line is also pointing in the same direction as the RSI signal, it can add confidence to the trade.
오픈 소스 스크립트
진정한 트레이딩뷰 정신에 따라 이 스크립트 작성자는 트레이더가 기능을 검토하고 검증할 수 있도록 오픈소스로 공개했습니다. 작성자에게 찬사를 보냅니다! 무료로 사용할 수 있지만 코드를 다시 게시할 경우 하우스 룰이 적용된다는 점을 기억하세요.
면책사항
이 정보와 게시물은 TradingView에서 제공하거나 보증하는 금융, 투자, 거래 또는 기타 유형의 조언이나 권고 사항을 의미하거나 구성하지 않습니다. 자세한 내용은 이용 약관을 참고하세요.
오픈 소스 스크립트
진정한 트레이딩뷰 정신에 따라 이 스크립트 작성자는 트레이더가 기능을 검토하고 검증할 수 있도록 오픈소스로 공개했습니다. 작성자에게 찬사를 보냅니다! 무료로 사용할 수 있지만 코드를 다시 게시할 경우 하우스 룰이 적용된다는 점을 기억하세요.
면책사항
이 정보와 게시물은 TradingView에서 제공하거나 보증하는 금융, 투자, 거래 또는 기타 유형의 조언이나 권고 사항을 의미하거나 구성하지 않습니다. 자세한 내용은 이용 약관을 참고하세요.