OPEN-SOURCE SCRIPT
업데이트됨 Trend Volume Accumulations [LuxAlgo]
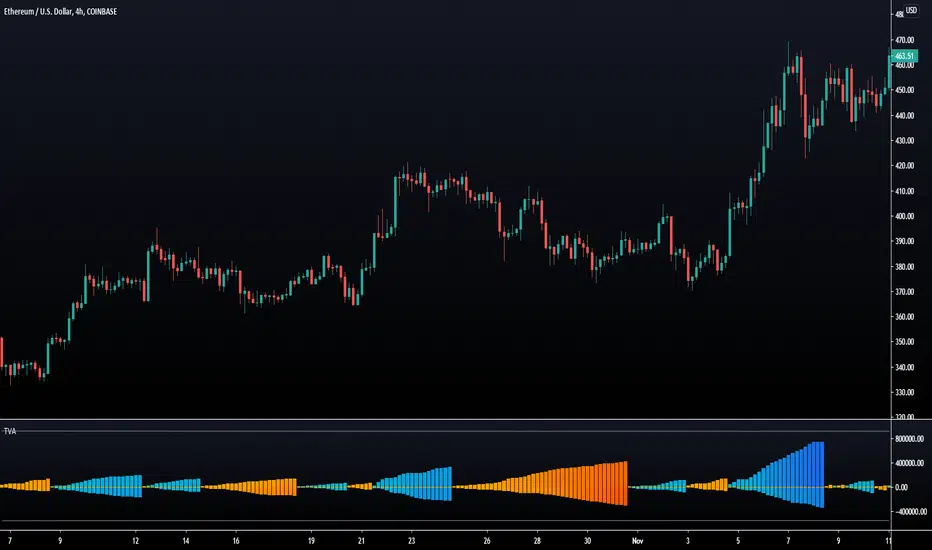
Deeply inspired by the Weiss wave indicator, the following indicator aims to return the accumulations of rising and declining volume of a specific trend. Positive waves are constructed using rising volume while negative waves are using declining volume.
The trend is determined by the sign of the rise of a rolling linear regression.
Settings
Usages
The trend volume accumulations (TVA) indicator allows determining the current price trend while taking into account volume, with blue colors representing an uptrend and red colors representing a downtrend.
The first motivation behind this indicator was to see if movements mostly made of declining volume were different from ones made of rising volume.

Waves of low amplitude represent movements with low trading activity.

Using higher values of Linearity allows giving less importance to individual volumes values, thus returning more linear waves as a result.

The indicator includes two levels, the upper one is derived from the cumulative mean of the waves based on rising volume, while the lower one is based on the cumulative mean of the waves based on declining volume, when a wave reaches a level we can expect the current trend to reverse. You can use different values of mult to control the distance from 0 of each level.
The trend is determined by the sign of the rise of a rolling linear regression.
Settings
- Length : Period of the indicator.
- Src : Source of the indicator.
- Linearity : Allows the output of the indicator to look more linear.
- Mult : the multiplicative factor of both the upper and lower levels
- Gradient : Use a gradient as color for the waves, true by default.
Usages
The trend volume accumulations (TVA) indicator allows determining the current price trend while taking into account volume, with blue colors representing an uptrend and red colors representing a downtrend.
The first motivation behind this indicator was to see if movements mostly made of declining volume were different from ones made of rising volume.
Waves of low amplitude represent movements with low trading activity.
Using higher values of Linearity allows giving less importance to individual volumes values, thus returning more linear waves as a result.
The indicator includes two levels, the upper one is derived from the cumulative mean of the waves based on rising volume, while the lower one is based on the cumulative mean of the waves based on declining volume, when a wave reaches a level we can expect the current trend to reverse. You can use different values of mult to control the distance from 0 of each level.
릴리즈 노트
Minor Changes.릴리즈 노트
Update to script title.오픈 소스 스크립트
트레이딩뷰의 진정한 정신에 따라, 이 스크립트의 작성자는 이를 오픈소스로 공개하여 트레이더들이 기능을 검토하고 검증할 수 있도록 했습니다. 작성자에게 찬사를 보냅니다! 이 코드는 무료로 사용할 수 있지만, 코드를 재게시하는 경우 하우스 룰이 적용된다는 점을 기억하세요.
Get exclusive indicators & AI trading strategies: luxalgo.com
Free 150k+ community: discord.gg/lux
All content provided by LuxAlgo is for informational & educational purposes only. Past performance does not guarantee future results.
Free 150k+ community: discord.gg/lux
All content provided by LuxAlgo is for informational & educational purposes only. Past performance does not guarantee future results.
면책사항
해당 정보와 게시물은 금융, 투자, 트레이딩 또는 기타 유형의 조언이나 권장 사항으로 간주되지 않으며, 트레이딩뷰에서 제공하거나 보증하는 것이 아닙니다. 자세한 내용은 이용 약관을 참조하세요.
오픈 소스 스크립트
트레이딩뷰의 진정한 정신에 따라, 이 스크립트의 작성자는 이를 오픈소스로 공개하여 트레이더들이 기능을 검토하고 검증할 수 있도록 했습니다. 작성자에게 찬사를 보냅니다! 이 코드는 무료로 사용할 수 있지만, 코드를 재게시하는 경우 하우스 룰이 적용된다는 점을 기억하세요.
Get exclusive indicators & AI trading strategies: luxalgo.com
Free 150k+ community: discord.gg/lux
All content provided by LuxAlgo is for informational & educational purposes only. Past performance does not guarantee future results.
Free 150k+ community: discord.gg/lux
All content provided by LuxAlgo is for informational & educational purposes only. Past performance does not guarantee future results.
면책사항
해당 정보와 게시물은 금융, 투자, 트레이딩 또는 기타 유형의 조언이나 권장 사항으로 간주되지 않으며, 트레이딩뷰에서 제공하거나 보증하는 것이 아닙니다. 자세한 내용은 이용 약관을 참조하세요.