OPEN-SOURCE SCRIPT
업데이트됨 DCA Position vs Cash Holding

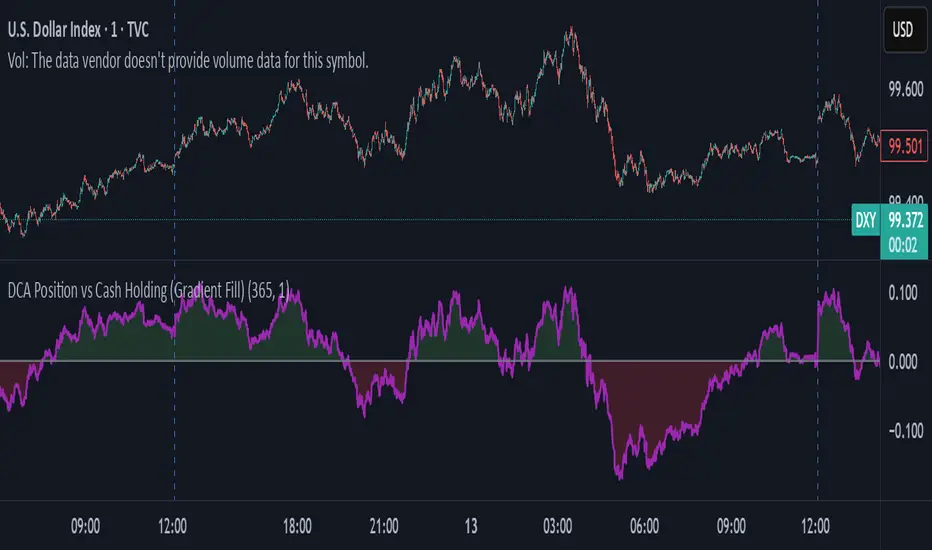
This indicator visualizes the performance of a simulated dollar-cost averaging (DCA) strategy compared to simply holding cash. It models the cumulative position size and value of buying a fixed dollar amount of the asset per candle over a configurable lookback period.
🔍 What It Shows:
Simulates buying $1 (or any amount) of the asset per candle
Tracks the total units accumulated and their current market value
Plots the difference between the DCA position value and total cash spent
Highlights when DCA buyers are underwater — a potential contrarian buy zone
📈 How to Use:
Values above zero indicate DCA outperformance vs cash
Values below zero signal structural drawdown — often a high-conviction bulk-buy opportunity
Use as a sentiment overlay to time discretionary adds or confirm regime shifts
⚙️ Inputs:
Lookback Window: Number of candles used to simulate DCA accumulation
DCA Amount: Dollar value purchased per candle
This tool is ideal for traders seeking to quantify accumulation efficiency, identify cycle inflection points, and visualize sentiment-weighted cost basis dynamics.
릴리즈 노트
Profits as a percentage of cash deployed릴리즈 노트
Shade negative and positive profit regions오픈 소스 스크립트
트레이딩뷰의 진정한 정신에 따라, 이 스크립트의 작성자는 이를 오픈소스로 공개하여 트레이더들이 기능을 검토하고 검증할 수 있도록 했습니다. 작성자에게 찬사를 보냅니다! 이 코드는 무료로 사용할 수 있지만, 코드를 재게시하는 경우 하우스 룰이 적용된다는 점을 기억하세요.
면책사항
해당 정보와 게시물은 금융, 투자, 트레이딩 또는 기타 유형의 조언이나 권장 사항으로 간주되지 않으며, 트레이딩뷰에서 제공하거나 보증하는 것이 아닙니다. 자세한 내용은 이용 약관을 참조하세요.
오픈 소스 스크립트
트레이딩뷰의 진정한 정신에 따라, 이 스크립트의 작성자는 이를 오픈소스로 공개하여 트레이더들이 기능을 검토하고 검증할 수 있도록 했습니다. 작성자에게 찬사를 보냅니다! 이 코드는 무료로 사용할 수 있지만, 코드를 재게시하는 경우 하우스 룰이 적용된다는 점을 기억하세요.
면책사항
해당 정보와 게시물은 금융, 투자, 트레이딩 또는 기타 유형의 조언이나 권장 사항으로 간주되지 않으며, 트레이딩뷰에서 제공하거나 보증하는 것이 아닙니다. 자세한 내용은 이용 약관을 참조하세요.