OPEN-SOURCE SCRIPT
Intersection Point

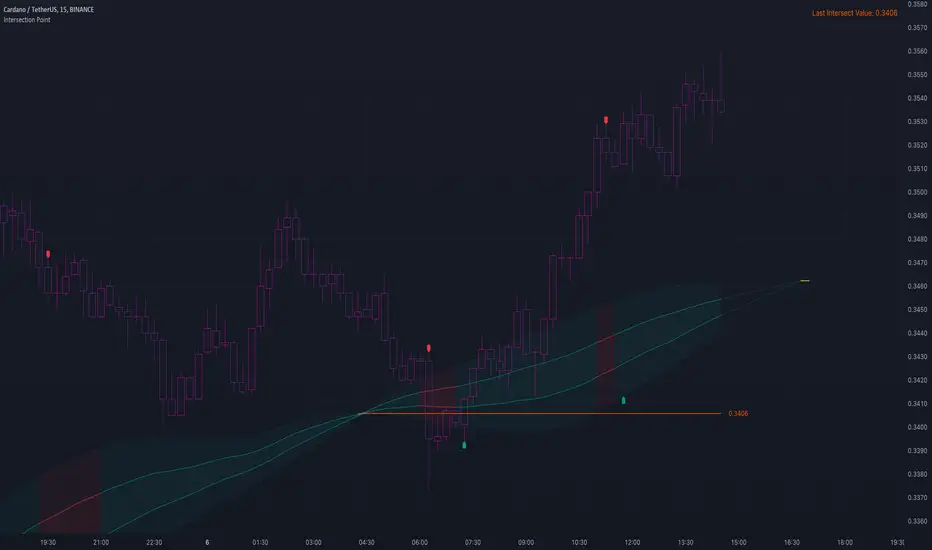
This publication focusses at the intersection of 2 lines, and a trend estimation derived from a comparison of Intersection Point value against current price value.

The formula to calculate the Intersection Point (IP) is:
Pine Script®
🔶 USAGE
🔹 Future / Past Intersection
The position where 2 lines would intersect in the future is shown here by extending both lines and a yellow small line to indicate its location:


Of course this can change easily when price changes.
If "Back" is enabled, the IP in history can be seen:

The yellow line which indicates the IP is only visible when it is not further located then +/- 500 bars from current bar.
If this point is further away, lines towards the IP still will be visible (max 500 bars further) without the IP.


🔹 Trend
The calculated intersection price is compared with the latest close and used for estimating the trend direction.


When close is above the intersection price (I), this is an indication the market is trending up, if close is below I, this would indicate the market is trending down.
The included bands can be useful for entry/SL/TP,...

🔶 DETAILS
🔹 Map.new()
All values are put in a map.new() with the function value()
The latest Intersection is also placed in this map with the function addLastIntersectValue() and retrieved at the last bar (right top)
🔹 Intersection Point Line
The intersection price can be made visible by enabling "Intersection Price" in SETTINGS -> STYLE. To ensure lines aren't drawn all over the place, this value is limited to maximum high + 200 days-ATR and minimum low - 200 days-ATR.

🔶 SETTINGS
🔹 Choose the value for both lines:
Type: choose between
• open, high, low, close,
• SMA, EMA, HullMA, WMA, VWMA, DEMA, TEMA
• The Length setting sets 1 of these Moving Averages when chosen
• src 1 -> You can pick an external source here
🔹 Length Intersection Line: Max length of line:
Intersection Line will update untillthe amount of bars reach the "Length Intersection Line"

💜 PURPLE BARS 😈
• Since TradingView has chosen to give away our precious Purple coloured Wizard Badge, bars are coloured purple 😊😉
The formula to calculate the Intersection Point (IP) is:
change1 = ta.change (valueLine1)
change2 = ta.change (valueLine2)
sf = (valueLine2[1] - valueLine1[1]) / (change1 - change2)
I = valueLine1[1] + change1 * sf
🔶 USAGE
🔹 Future / Past Intersection
The position where 2 lines would intersect in the future is shown here by extending both lines and a yellow small line to indicate its location:
Of course this can change easily when price changes.
If "Back" is enabled, the IP in history can be seen:
The yellow line which indicates the IP is only visible when it is not further located then +/- 500 bars from current bar.
If this point is further away, lines towards the IP still will be visible (max 500 bars further) without the IP.
🔹 Trend
The calculated intersection price is compared with the latest close and used for estimating the trend direction.
When close is above the intersection price (I), this is an indication the market is trending up, if close is below I, this would indicate the market is trending down.
The included bands can be useful for entry/SL/TP,...
🔶 DETAILS
🔹 Map.new()
All values are put in a map.new() with the function value()
The latest Intersection is also placed in this map with the function addLastIntersectValue() and retrieved at the last bar (right top)
🔹 Intersection Point Line
The intersection price can be made visible by enabling "Intersection Price" in SETTINGS -> STYLE. To ensure lines aren't drawn all over the place, this value is limited to maximum high + 200 days-ATR and minimum low - 200 days-ATR.
🔶 SETTINGS
🔹 Choose the value for both lines:
Type: choose between
• open, high, low, close,
• SMA, EMA, HullMA, WMA, VWMA, DEMA, TEMA
• The Length setting sets 1 of these Moving Averages when chosen
• src 1 -> You can pick an external source here
🔹 Length Intersection Line: Max length of line:
Intersection Line will update untillthe amount of bars reach the "Length Intersection Line"
💜 PURPLE BARS 😈
• Since TradingView has chosen to give away our precious Purple coloured Wizard Badge, bars are coloured purple 😊😉
오픈 소스 스크립트
트레이딩뷰의 진정한 정신에 따라, 이 스크립트의 작성자는 이를 오픈소스로 공개하여 트레이더들이 기능을 검토하고 검증할 수 있도록 했습니다. 작성자에게 찬사를 보냅니다! 이 코드는 무료로 사용할 수 있지만, 코드를 재게시하는 경우 하우스 룰이 적용된다는 점을 기억하세요.
Who are PineCoders?
tradingview.com/chart/SSP/yW5eOqtm-Who-are-PineCoders/
TG Pine Script® Q&A: t.me/PineCodersQA
- We cannot control our emotions,
but we can control our keyboard -
tradingview.com/chart/SSP/yW5eOqtm-Who-are-PineCoders/
TG Pine Script® Q&A: t.me/PineCodersQA
- We cannot control our emotions,
but we can control our keyboard -
면책사항
해당 정보와 게시물은 금융, 투자, 트레이딩 또는 기타 유형의 조언이나 권장 사항으로 간주되지 않으며, 트레이딩뷰에서 제공하거나 보증하는 것이 아닙니다. 자세한 내용은 이용 약관을 참조하세요.