OPEN-SOURCE SCRIPT
Vector Candles
Title: Vector Candles Indicator with PVSRA
Short Description: Visualize climax and above-average volume candles using PVSRA method for trend reversals and significant moves.
Long Description:
The Vector Candles Indicator with PVSRA (Price, Volume, Support, and Resistance Analysis) is designed to help traders visualize climax and above-average volume candles on the chart, which can indicate potential trend reversals and significant market moves. This indicator is suitable for various financial instruments, including stocks, forex, and cryptocurrencies.
This script uses the PVSRA method to determine the candle colour based on volume and price action. By analysing the relationships between price, volume, and support/resistance levels, it allows traders to better understand the market dynamics and make informed decisions.
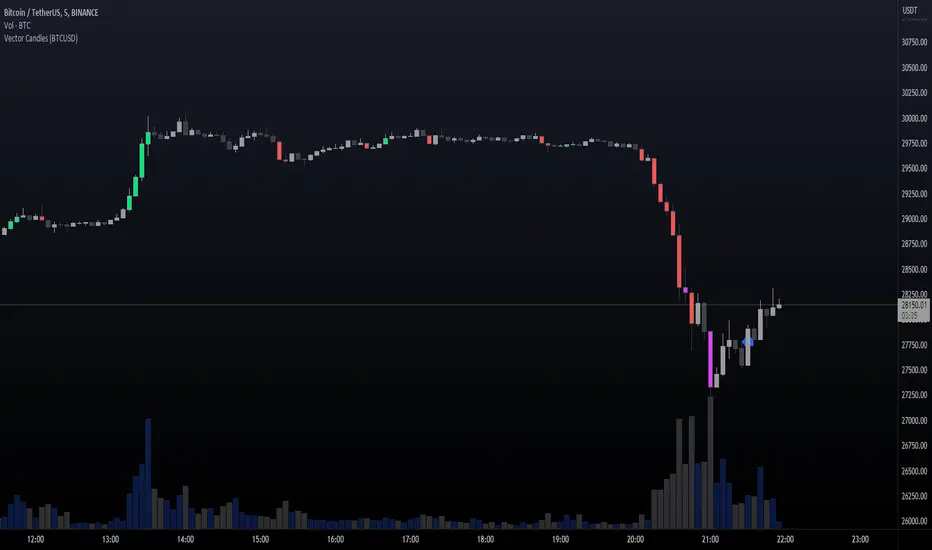
The indicator displays candles in different colours to represent the volume and price action:
Climax Up (Lime): Bullish candle with high volume
Climax Down (Red): Bearish candle with high volume
Above Average Up (Blue): Bullish candle with above-average volume
Above Average Down (Fuchsia): Bearish candle with above-average volume
Normal Up (Gray): Bullish candle with normal volume
Normal Down (Dark Gray): Bearish candle with normal volume
The script is designed to work on the TradingView platform and is based on original contributions by plasmapug, infernix, peshocore, and xtech5192. It has been modified RapidFireOG for easy integration into your trading setup.
Add this powerful tool to your chart and enhance your trading analysis with the Vector Candles Indicator with PVSRA.
Short Description: Visualize climax and above-average volume candles using PVSRA method for trend reversals and significant moves.
Long Description:
The Vector Candles Indicator with PVSRA (Price, Volume, Support, and Resistance Analysis) is designed to help traders visualize climax and above-average volume candles on the chart, which can indicate potential trend reversals and significant market moves. This indicator is suitable for various financial instruments, including stocks, forex, and cryptocurrencies.
This script uses the PVSRA method to determine the candle colour based on volume and price action. By analysing the relationships between price, volume, and support/resistance levels, it allows traders to better understand the market dynamics and make informed decisions.
The indicator displays candles in different colours to represent the volume and price action:
Climax Up (Lime): Bullish candle with high volume
Climax Down (Red): Bearish candle with high volume
Above Average Up (Blue): Bullish candle with above-average volume
Above Average Down (Fuchsia): Bearish candle with above-average volume
Normal Up (Gray): Bullish candle with normal volume
Normal Down (Dark Gray): Bearish candle with normal volume
The script is designed to work on the TradingView platform and is based on original contributions by plasmapug, infernix, peshocore, and xtech5192. It has been modified RapidFireOG for easy integration into your trading setup.
Add this powerful tool to your chart and enhance your trading analysis with the Vector Candles Indicator with PVSRA.
오픈 소스 스크립트
트레이딩뷰의 진정한 정신에 따라, 이 스크립트의 작성자는 이를 오픈소스로 공개하여 트레이더들이 기능을 검토하고 검증할 수 있도록 했습니다. 작성자에게 찬사를 보냅니다! 이 코드는 무료로 사용할 수 있지만, 코드를 재게시하는 경우 하우스 룰이 적용된다는 점을 기억하세요.
면책사항
해당 정보와 게시물은 금융, 투자, 트레이딩 또는 기타 유형의 조언이나 권장 사항으로 간주되지 않으며, 트레이딩뷰에서 제공하거나 보증하는 것이 아닙니다. 자세한 내용은 이용 약관을 참조하세요.
오픈 소스 스크립트
트레이딩뷰의 진정한 정신에 따라, 이 스크립트의 작성자는 이를 오픈소스로 공개하여 트레이더들이 기능을 검토하고 검증할 수 있도록 했습니다. 작성자에게 찬사를 보냅니다! 이 코드는 무료로 사용할 수 있지만, 코드를 재게시하는 경우 하우스 룰이 적용된다는 점을 기억하세요.
면책사항
해당 정보와 게시물은 금융, 투자, 트레이딩 또는 기타 유형의 조언이나 권장 사항으로 간주되지 않으며, 트레이딩뷰에서 제공하거나 보증하는 것이 아닙니다. 자세한 내용은 이용 약관을 참조하세요.