OPEN-SOURCE SCRIPT
Bankruptcy Risk: Altman Z-Score, Zmijewski Score, Grover G
This custom indicator calculates three common bankruptcy risk scores:
Altman Z-Score
Zmijewski Score
Grover Model: G-Score
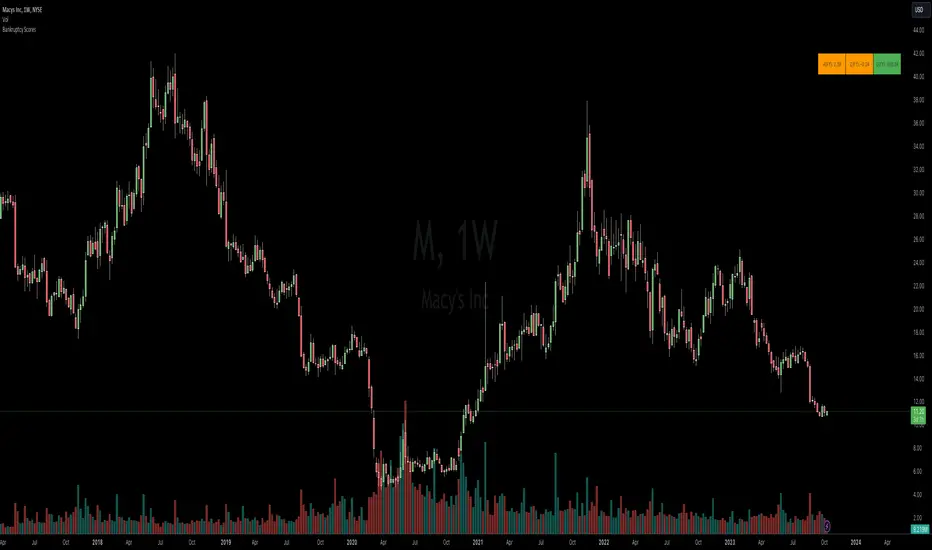
The indicator pulls key financial metrics and calculates each score, then displays the results in a table with color-coding based on the level of bankruptcy risk.
Users can toggle between FQ and FY periods and view details on the underlying metrics. This provides an easy way to visualize bankruptcy risk for a company and compare across different scoring models.
Useful for fundamental analysis and assessing financial health.
The financial ratios and methodology are based on research described in
"Analysis of Bankruptcy Prediction Models in Determining Bankruptcy of Consumer Goods Companies in Indonesia" (Thomas et al., 2020).
- Altman Z-Score
- Zmijewski Score
- Grover G-Score
Altman Z-Score
- Companies are in healthy condition if the Z-Score > 2.6.
- Companies are in vulnerable conditions and need improvement (grey area) if the score is between 1.1 - 2.6.
- Companies have the potential to lead to serious bankruptcy if the Z-Score < 1.1.
Zmijewski Score
- The company has the potential to go bankrupt if the value of X Score > 0.
- The company is healthy if the value of X Score < 0.
Grover Model: G-Score
- The company has the potential to go bankrupt if the G Score ≤ -0.02.
- The company is in good health if the value of G Score ≥ 0.001.
The indicator pulls key financial metrics and calculates each score, then displays the results in a table with color-coding based on the level of bankruptcy risk.
Users can toggle between FQ and FY periods and view details on the underlying metrics. This provides an easy way to visualize bankruptcy risk for a company and compare across different scoring models.
Useful for fundamental analysis and assessing financial health.
The financial ratios and methodology are based on research described in
"Analysis of Bankruptcy Prediction Models in Determining Bankruptcy of Consumer Goods Companies in Indonesia" (Thomas et al., 2020).
오픈 소스 스크립트
트레이딩뷰의 진정한 정신에 따라, 이 스크립트의 작성자는 이를 오픈소스로 공개하여 트레이더들이 기능을 검토하고 검증할 수 있도록 했습니다. 작성자에게 찬사를 보냅니다! 이 코드는 무료로 사용할 수 있지만, 코드를 재게시하는 경우 하우스 룰이 적용된다는 점을 기억하세요.
면책사항
해당 정보와 게시물은 금융, 투자, 트레이딩 또는 기타 유형의 조언이나 권장 사항으로 간주되지 않으며, 트레이딩뷰에서 제공하거나 보증하는 것이 아닙니다. 자세한 내용은 이용 약관을 참조하세요.
오픈 소스 스크립트
트레이딩뷰의 진정한 정신에 따라, 이 스크립트의 작성자는 이를 오픈소스로 공개하여 트레이더들이 기능을 검토하고 검증할 수 있도록 했습니다. 작성자에게 찬사를 보냅니다! 이 코드는 무료로 사용할 수 있지만, 코드를 재게시하는 경우 하우스 룰이 적용된다는 점을 기억하세요.
면책사항
해당 정보와 게시물은 금융, 투자, 트레이딩 또는 기타 유형의 조언이나 권장 사항으로 간주되지 않으며, 트레이딩뷰에서 제공하거나 보증하는 것이 아닙니다. 자세한 내용은 이용 약관을 참조하세요.