OPEN-SOURCE SCRIPT
25 Day and 125 Day EMA Trend Indicator
The "25 and 125 EMA Trend indicator," is a powerful yet simple tool designed for use on any TradingView chart. Its primary purpose is to help traders visually identify both short-term and long-term trends in the market.
How the Script Works
The script is built around two Exponential Moving Averages (EMAs), which are a type of moving average that gives more weight to recent price data. This makes them more responsive to current market changes than a Simple Moving Average (SMA). The two EMAs are:
Trading Signals and Interpretation
The real value of this script comes from observing the relationship between the two EMA lines.
Customisation
The script includes user-friendly input fields that allow you to customise the lengths of both EMAs directly from the indicator's settings on the chart. This lets you experiment with different time frames and tailor the indicator to your specific trading strategy.
How the Script Works
The script is built around two Exponential Moving Averages (EMAs), which are a type of moving average that gives more weight to recent price data. This makes them more responsive to current market changes than a Simple Moving Average (SMA). The two EMAs are:
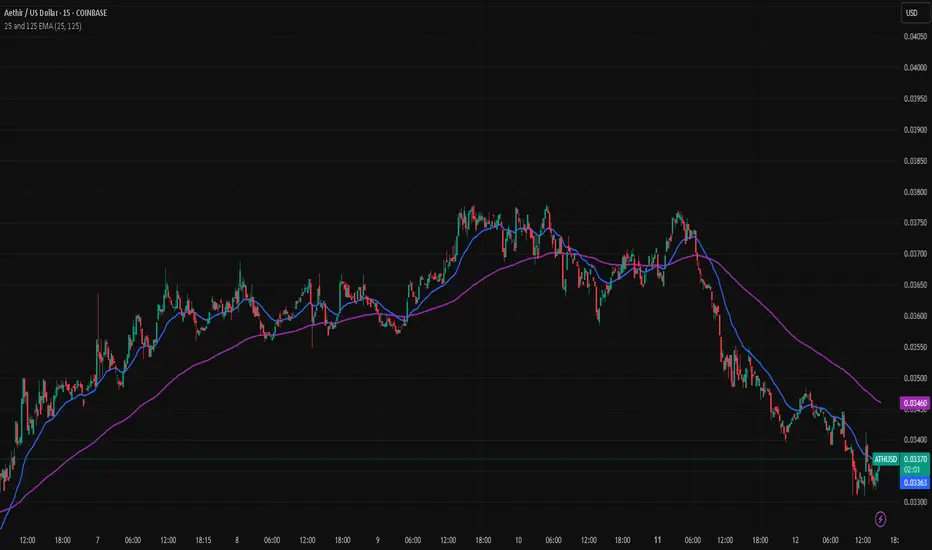
- Fast EMA (25-day): Represented by the blue line, this EMA reacts quickly to price fluctuations. It's excellent for identifying the current short-term direction and momentum of the asset.
- Slow EMA (125-day): Represented by the purple line, this EMA smooths out price action over a much longer period. It's used to determine the underlying, long-term trend of the market.
Trading Signals and Interpretation
The real value of this script comes from observing the relationship between the two EMA lines.
- Uptrend: When the blue (25-day) EMA is above the purple (125-day) EMA, it indicates that the short-term trend is stronger than the long-term trend, signaling a bullish or upward-moving market.
- Downtrend: Conversely, when the blue EMA is below the purple EMA, it suggests that the short-term trend is weaker, indicating a bearish or downward-moving market.
- Cross-overs: The most important signals are often generated when the two lines cross.
- A bullish cross (or "golden cross") occurs when the blue EMA crosses above the purple EMA. This can be a signal that a new, strong uptrend is beginning.
- A bearish cross (or "death cross") occurs when the blue EMA crosses below the purple EMA. This may signal the start of a new downtrend.
Customisation
The script includes user-friendly input fields that allow you to customise the lengths of both EMAs directly from the indicator's settings on the chart. This lets you experiment with different time frames and tailor the indicator to your specific trading strategy.
오픈 소스 스크립트
트레이딩뷰의 진정한 정신에 따라, 이 스크립트의 작성자는 이를 오픈소스로 공개하여 트레이더들이 기능을 검토하고 검증할 수 있도록 했습니다. 작성자에게 찬사를 보냅니다! 이 코드는 무료로 사용할 수 있지만, 코드를 재게시하는 경우 하우스 룰이 적용된다는 점을 기억하세요.
면책사항
해당 정보와 게시물은 금융, 투자, 트레이딩 또는 기타 유형의 조언이나 권장 사항으로 간주되지 않으며, 트레이딩뷰에서 제공하거나 보증하는 것이 아닙니다. 자세한 내용은 이용 약관을 참조하세요.
오픈 소스 스크립트
트레이딩뷰의 진정한 정신에 따라, 이 스크립트의 작성자는 이를 오픈소스로 공개하여 트레이더들이 기능을 검토하고 검증할 수 있도록 했습니다. 작성자에게 찬사를 보냅니다! 이 코드는 무료로 사용할 수 있지만, 코드를 재게시하는 경우 하우스 룰이 적용된다는 점을 기억하세요.
면책사항
해당 정보와 게시물은 금융, 투자, 트레이딩 또는 기타 유형의 조언이나 권장 사항으로 간주되지 않으며, 트레이딩뷰에서 제공하거나 보증하는 것이 아닙니다. 자세한 내용은 이용 약관을 참조하세요.