INVITE-ONLY SCRIPT
NKP Strength Meter
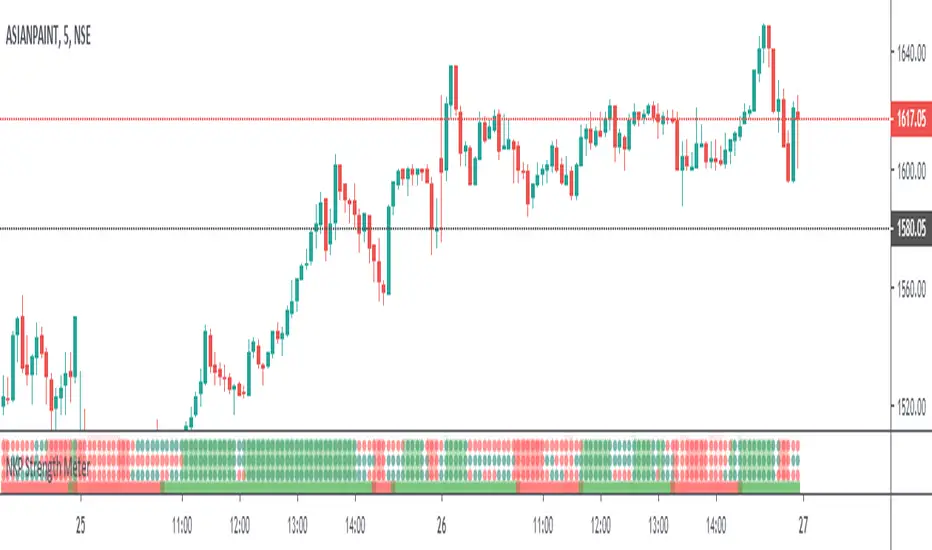
NKP Strength Meter is an indicator it will show the strength of the trend based on built-ins indicators like RSI , MACD , ADX , PSAR and some mathematical formulas. we can apply in any time frame. it is dynamically calculate the values based which time frame user got selected. By using this we can trend strength, read on. ( we can apply this in any time frame chart)
NKP Strength Meter has 3 main components:
one trend bar - it will plot only in two colors either Green or Red. Green indicates buy strength Red indicates sell strength.
three trend dotted lines - these also will plot only in two color either Red or Green. Green indicates buy strength Red indicates sell strength.
color plotted area - if all are in the Green it will plot the green background. all are in red it will plot the red background based these we can easily identify the strength of the trend while seeing the chart.
How does it work?
If all trend bar and dotted lines are green it means buyers strength is more.(continue with uptrend)
If all trend bar and dotted lines are red it means seller strength is more.(continue with downtrend)
mixed colors on dotted line and trend bar there is strength at that time.
What are the signals?
it wont generate any signals. just it will plot the strength dotted lines and trend bar it identify the strength of the trend.
Can we set the Alert on this?
No, it will use to see the strength of the trend while taking the order.(just for trend confirmation)
IMPORTANT: this script does not generate any signals. Perfectly catches long runs in trends at all underlings (stocks, indexes ) at any time frame.
Try it! Good luck and good trading!
For access, please PM us or visit the link below in our Signature.
초대 전용 스크립트
이 스크립트는 작성자가 승인한 사용자만 접근할 수 있습니다. 사용하려면 요청 후 승인을 받아야 하며, 일반적으로 결제 후에 허가가 부여됩니다. 자세한 내용은 아래 작성자의 안내를 따르거나 NKPTechnicalTrader에게 직접 문의하세요.
트레이딩뷰는 스크립트의 작동 방식을 충분히 이해하고 작성자를 완전히 신뢰하지 않는 이상, 해당 스크립트에 비용을 지불하거나 사용하는 것을 권장하지 않습니다. 커뮤니티 스크립트에서 무료 오픈소스 대안을 찾아보실 수도 있습니다.
작성자 지시 사항
면책사항
해당 정보와 게시물은 금융, 투자, 트레이딩 또는 기타 유형의 조언이나 권장 사항으로 간주되지 않으며, 트레이딩뷰에서 제공하거나 보증하는 것이 아닙니다. 자세한 내용은 이용 약관을 참조하세요.