INVITE-ONLY SCRIPT
SFC True COT Reports
The Commodity Futures Trading Commission (Commission or CFTC) publishes the Commitments of Traders ( COT ) reports to help the public understand market dynamics. Specifically, the COT reports provide a breakdown of each Tuesday’s open interest for futures and options on futures markets in which 20 or more traders hold positions equal to or above the reporting levels established by the CFTC.
This indicator can display three similar, but also very different calculations:
- Net positions of the leveraged/managed Money
- COT Index
- COT True Index
Net Positions
The COT report is not a timing instrument. It shows us markets in which the trend remains stable OR where there could be a change in trend. But it does not give us clear information as to *WHEN* an entry into the market should take place.
Net positions are showing if the professional traders have bullish or bearish bias.
COT Index
After calculating the net positions, we are already one step further, but have not yet reached our goal. The net position itself does not tell us anything about how the commercials have actually positioned themselves. If we only know that the commercials are 15,782 contracts short this week, that does not help us much.
We need an indicator that lets us evaluate this figure. And we get it by relating the current position to the positions over a certain period. So, an index is calculated, that allows us to evaluate the current position as a percentage.
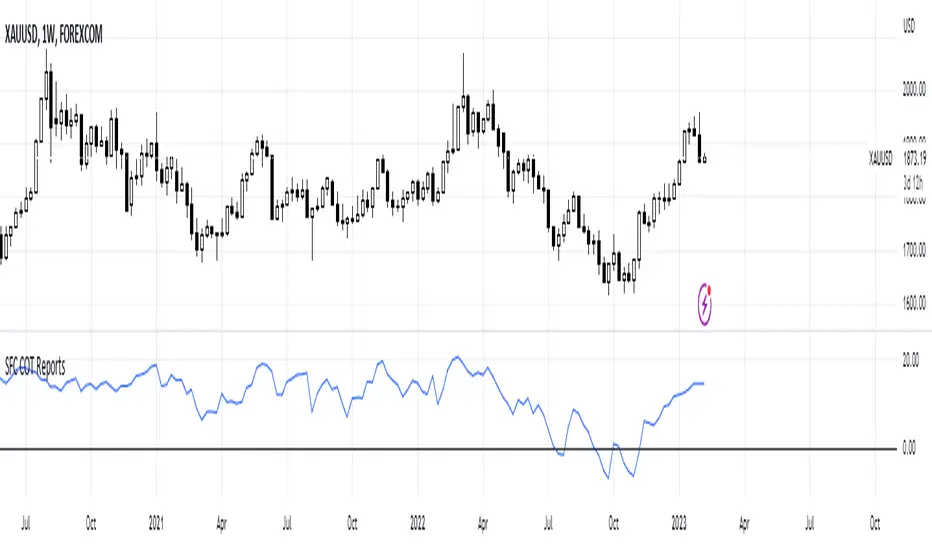
COT True Index
COT Index can give us very good idea how bullish or bearish are the professional traders, but it is limit to 0% and 100%. In this case an additional calculation is needed in order to remove this limitation and show us the true bias.
How to use the true index:
1) If the curve is below zero line means that the traders officially changed the bias from bullish to bearish . Before that we can consider that they are still bullish and price is retracing or consolidation, and vice versa
2) We can also measure the strength of the bias. For example if the curve is below zero line, but only few precent, we may consider that the bias is changing but it is still weak bearish bias.
3) We can use the chart to see where are the peaks and troughs. They are using as support and resistance and we can expect a general chance at these levels.
Supported pairs:
'XAUUSD' , 'XAGUSD' , 'COPPER' , 'PLATINUM' 'PALLADIUM';
'AUDUSD' ,'USDCAD' , 'GBPUSD' , 'EURUSD' , 'USDJPY' , 'DXY';
'US30USD' ,'SPX500USD' , 'NAS100USD';
'US02Y' , 'US05Y' , 'US10Y'
'BTCUSD'
Note: The curve of the US Yields is inverted, because actually shows the Bond market and not the Yields. This is not a problem, because Yields have perfect negative correlations with Bonds.
The indicator works only on weekly time frame.
This indicator can display three similar, but also very different calculations:
- Net positions of the leveraged/managed Money
- COT Index
- COT True Index
Net Positions
The COT report is not a timing instrument. It shows us markets in which the trend remains stable OR where there could be a change in trend. But it does not give us clear information as to *WHEN* an entry into the market should take place.
Net positions are showing if the professional traders have bullish or bearish bias.
COT Index
After calculating the net positions, we are already one step further, but have not yet reached our goal. The net position itself does not tell us anything about how the commercials have actually positioned themselves. If we only know that the commercials are 15,782 contracts short this week, that does not help us much.
We need an indicator that lets us evaluate this figure. And we get it by relating the current position to the positions over a certain period. So, an index is calculated, that allows us to evaluate the current position as a percentage.
COT True Index
COT Index can give us very good idea how bullish or bearish are the professional traders, but it is limit to 0% and 100%. In this case an additional calculation is needed in order to remove this limitation and show us the true bias.
How to use the true index:
1) If the curve is below zero line means that the traders officially changed the bias from bullish to bearish . Before that we can consider that they are still bullish and price is retracing or consolidation, and vice versa
2) We can also measure the strength of the bias. For example if the curve is below zero line, but only few precent, we may consider that the bias is changing but it is still weak bearish bias.
3) We can use the chart to see where are the peaks and troughs. They are using as support and resistance and we can expect a general chance at these levels.
Supported pairs:
'XAUUSD' , 'XAGUSD' , 'COPPER' , 'PLATINUM' 'PALLADIUM';
'AUDUSD' ,'USDCAD' , 'GBPUSD' , 'EURUSD' , 'USDJPY' , 'DXY';
'US30USD' ,'SPX500USD' , 'NAS100USD';
'US02Y' , 'US05Y' , 'US10Y'
'BTCUSD'
Note: The curve of the US Yields is inverted, because actually shows the Bond market and not the Yields. This is not a problem, because Yields have perfect negative correlations with Bonds.
The indicator works only on weekly time frame.
초대 전용 스크립트
이 스크립트는 작성자가 승인한 사용자만 접근할 수 있습니다. 사용하려면 요청 후 승인을 받아야 하며, 일반적으로 결제 후에 허가가 부여됩니다. 자세한 내용은 아래 작성자의 안내를 따르거나 SerpentForexClub에게 직접 문의하세요.
트레이딩뷰는 스크립트의 작동 방식을 충분히 이해하고 작성자를 완전히 신뢰하지 않는 이상, 해당 스크립트에 비용을 지불하거나 사용하는 것을 권장하지 않습니다. 커뮤니티 스크립트에서 무료 오픈소스 대안을 찾아보실 수도 있습니다.
작성자 지시 사항
Reach me through PM system.
면책사항
해당 정보와 게시물은 금융, 투자, 트레이딩 또는 기타 유형의 조언이나 권장 사항으로 간주되지 않으며, 트레이딩뷰에서 제공하거나 보증하는 것이 아닙니다. 자세한 내용은 이용 약관을 참조하세요.