OPEN-SOURCE SCRIPT
업데이트됨 Shares Risk (Long)

Ever struggle to know how many shares you should be placing your order with? Risk is different for every person and every stock. This can help.
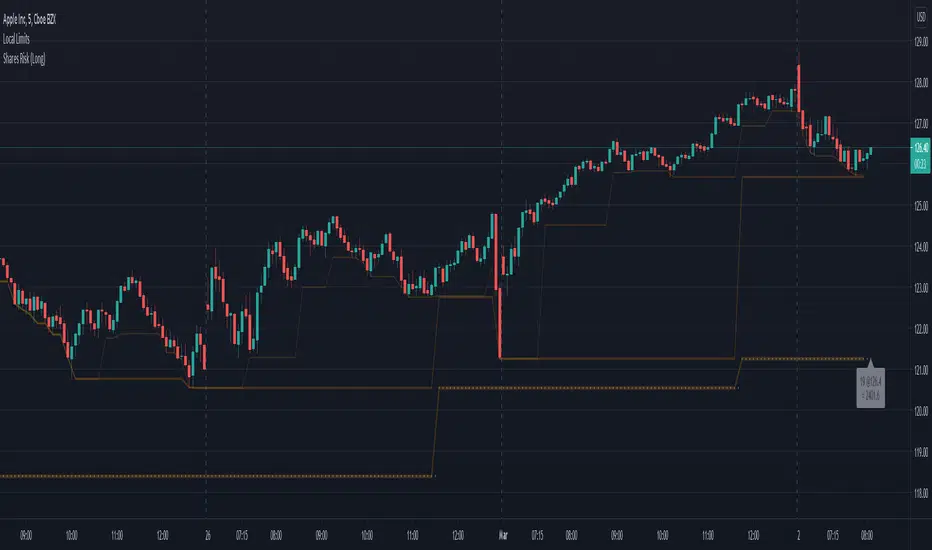
In the example above, I've added this indicator the the chart.
I then specified:
Based upon how much I'm willing to risk, and the price difference between the close and Risk Source, this indicator will show the number of shares to purchase such that if the price drops to the stop level specified, my value loss should be limited to the Risk Amount.
333 shares is the value calculated for this example (latest bar). You can easily see how many shares you need to purchase for the lastest bar as well as track the previous values on the chart and the indicator cursor data.
---
** WARNING: There's no magic here. It's just math. So if you specify another indicator as the source, the values could get a bit strange and if the price is very close to the stop level, the number of shares could be unreasonably high. To help avoid this you can increase the minimum percent.
In the example above, I've added this indicator the the chart.
I then specified:
- Risk Amount ($) = $500. (The max amount I'm willing to risk.)
- Risk Source = (another indicator) Lower Limit 3. (See Lower Limits for more details)
- Source Risk (%) = 0.0 (The default is 5.0 expecting the Risk Source to be the close.**)
Based upon how much I'm willing to risk, and the price difference between the close and Risk Source, this indicator will show the number of shares to purchase such that if the price drops to the stop level specified, my value loss should be limited to the Risk Amount.
333 shares is the value calculated for this example (latest bar). You can easily see how many shares you need to purchase for the lastest bar as well as track the previous values on the chart and the indicator cursor data.
---
** WARNING: There's no magic here. It's just math. So if you specify another indicator as the source, the values could get a bit strange and if the price is very close to the stop level, the number of shares could be unreasonably high. To help avoid this you can increase the minimum percent.
릴리즈 노트
Updated position of chart to make label more visible.릴리즈 노트
- Improved label.
- Used Local Limit 4 instead with corrected parameters.
릴리즈 노트
Improved source value handling: Some sources are delayed because of their time frame and effectively report NaN until their next bar. This change persists their previously known value.오픈 소스 스크립트
트레이딩뷰의 진정한 정신에 따라, 이 스크립트의 작성자는 이를 오픈소스로 공개하여 트레이더들이 기능을 검토하고 검증할 수 있도록 했습니다. 작성자에게 찬사를 보냅니다! 이 코드는 무료로 사용할 수 있지만, 코드를 재게시하는 경우 하우스 룰이 적용된다는 점을 기억하세요.
면책사항
해당 정보와 게시물은 금융, 투자, 트레이딩 또는 기타 유형의 조언이나 권장 사항으로 간주되지 않으며, 트레이딩뷰에서 제공하거나 보증하는 것이 아닙니다. 자세한 내용은 이용 약관을 참조하세요.
오픈 소스 스크립트
트레이딩뷰의 진정한 정신에 따라, 이 스크립트의 작성자는 이를 오픈소스로 공개하여 트레이더들이 기능을 검토하고 검증할 수 있도록 했습니다. 작성자에게 찬사를 보냅니다! 이 코드는 무료로 사용할 수 있지만, 코드를 재게시하는 경우 하우스 룰이 적용된다는 점을 기억하세요.
면책사항
해당 정보와 게시물은 금융, 투자, 트레이딩 또는 기타 유형의 조언이나 권장 사항으로 간주되지 않으며, 트레이딩뷰에서 제공하거나 보증하는 것이 아닙니다. 자세한 내용은 이용 약관을 참조하세요.