OPEN-SOURCE SCRIPT
Rough Average
업데이트됨
The Rough Average indicator is a unique technical tool that calculates a modified average to provide insights into market conditions. It incorporates a combination of mathematical operations and existing indicators to offer traders a different perspective on price movements.
The Rough Average indicator aims to capture market dynamics through a specific calculation method. It utilizes two main components: a check for the approximate scale of the price and a profile calculation based on the Relative Strength Index (RSI) of the closing price.
Methodology:
Indicator Calculation:
The Rough Average is derived by applying the Exponential Moving Average (EMA) to the calculated profile. The EMA is a smoothing technique that emphasizes recent price data. The resulting value represents the modified average of the indicator.
Utility:
The Rough Average indicator offers traders an alternative perspective on market conditions. By utilizing a modified average calculation, it can reveal potential trends, reversals, or periods of market strength or weakness. Traders can use the Rough Average to complement their analysis and identify possible trading opportunities.
It is important to note that the effectiveness of the Rough Average indicator may vary depending on the specific market and trading strategy. It is recommended to combine its analysis with other technical indicators and conduct thorough testing before making trading decisions.
Key Features:
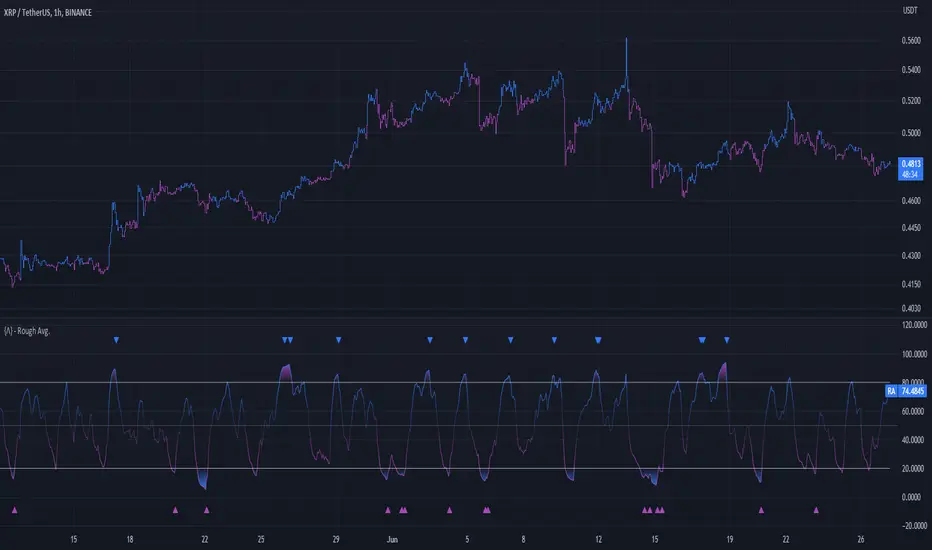
Example Charts:

The Rough Average indicator aims to capture market dynamics through a specific calculation method. It utilizes two main components: a check for the approximate scale of the price and a profile calculation based on the Relative Strength Index (RSI) of the closing price.
Methodology:
- Approximate Scale: The indicator determines the approximate scale of the price by analyzing the magnitude of the closing price. This step involves a mathematical process that identifies the power of 10 that best represents the scale. This function reduces overall lag and gives a better smoothing to the output of the calculation
- Profile Calculation: The indicator calculates a profile value by summing the absolute values of the RSI of the closing price over a specified period. The RSI provides insights into the strength or weakness of price movements. The profile calculation considers a range of prices based on the determined scale.
Indicator Calculation:
The Rough Average is derived by applying the Exponential Moving Average (EMA) to the calculated profile. The EMA is a smoothing technique that emphasizes recent price data. The resulting value represents the modified average of the indicator.
Utility:
The Rough Average indicator offers traders an alternative perspective on market conditions. By utilizing a modified average calculation, it can reveal potential trends, reversals, or periods of market strength or weakness. Traders can use the Rough Average to complement their analysis and identify possible trading opportunities.
It is important to note that the effectiveness of the Rough Average indicator may vary depending on the specific market and trading strategy. It is recommended to combine its analysis with other technical indicators and conduct thorough testing before making trading decisions.
Key Features:
- Customizable OB\OS Levels
- Bar coloring methods: Trend, Reversions, Extremities
Example Charts:
릴리즈 노트
Updated license오픈 소스 스크립트
진정한 TradingView 정신에 따라, 이 스크립트의 저자는 트레이더들이 이해하고 검증할 수 있도록 오픈 소스로 공개했습니다. 저자에게 박수를 보냅니다! 이 코드는 무료로 사용할 수 있지만, 출판물에서 이 코드를 재사용하는 것은 하우스 룰에 의해 관리됩니다. 님은 즐겨찾기로 이 스크립트를 차트에서 쓸 수 있습니다.
면책사항
이 정보와 게시물은 TradingView에서 제공하거나 보증하는 금융, 투자, 거래 또는 기타 유형의 조언이나 권고 사항을 의미하거나 구성하지 않습니다. 자세한 내용은 이용 약관을 참고하세요.