OPEN-SOURCE SCRIPT
Bijnor Pivot Extended
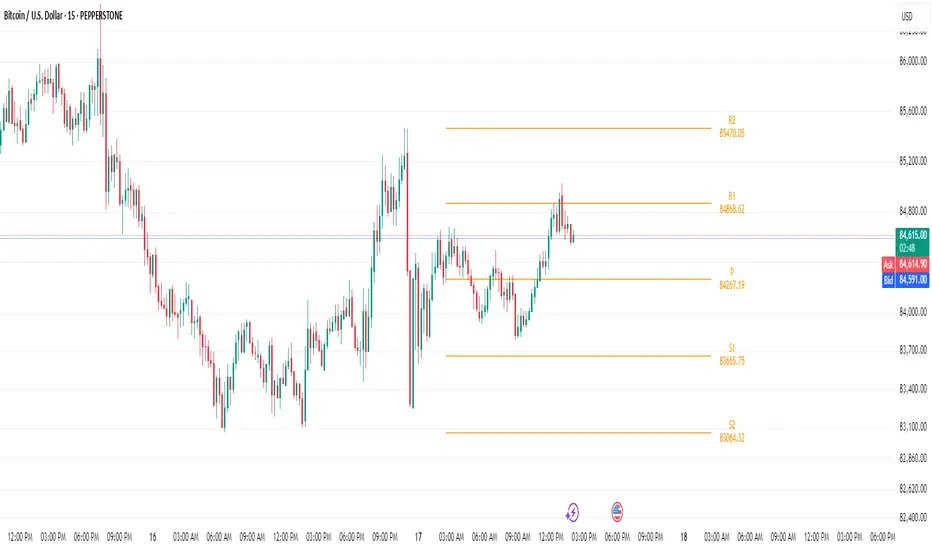
Overview: The Bijnor Pivot Extended (BP+) indicator is a powerful visual tool designed to help traders identify key price levels using Fibonacci-based pivots. It dynamically plots Support and Resistance levels based on your chosen timeframe (Daily, Weekly, or Monthly) and displays them only for the current session, reducing chart clutter and improving focus.
🔧 Features:
📆 Pivot Timeframe Selection: Choose between Daily, Weekly, or Monthly pivots.
🎯 Fibonacci Pivot Levels:
Central Pivot (P)
Resistance: R1, R2, R3, R4 (Extended)
Support: S1, S2, S3, S4 (Extended)
🎨 Full Customization:
Toggle labels and prices on/off
Position labels to the left or right
Change line width and individual colors for pivot, support, and resistance lines
🧠 Smart Line Plotting:
Lines are drawn only during the selected session, keeping your chart clean
🕹️ Max Performance: Optimized to stay lightweight with max_lines_count and max_labels_count set to 500
🧭 How to Use It:
Use this indicator to:
Plan entries and exits around key Fibonacci pivot zones
Identify overbought/oversold zones at R3/R4 and S3/S4
Enhance your intraday, swing, or positional trading setups
Combine with price action, candlestick patterns, or volume for maximum edge.
✅ Bonus:
This script is ideal for traders looking for a minimalist yet powerful pivot framework, with extended levels for breakout or reversal scenarios.
오픈 소스 스크립트
트레이딩뷰의 진정한 정신에 따라, 이 스크립트의 작성자는 이를 오픈소스로 공개하여 트레이더들이 기능을 검토하고 검증할 수 있도록 했습니다. 작성자에게 찬사를 보냅니다! 이 코드는 무료로 사용할 수 있지만, 코드를 재게시하는 경우 하우스 룰이 적용된다는 점을 기억하세요.
면책사항
해당 정보와 게시물은 금융, 투자, 트레이딩 또는 기타 유형의 조언이나 권장 사항으로 간주되지 않으며, 트레이딩뷰에서 제공하거나 보증하는 것이 아닙니다. 자세한 내용은 이용 약관을 참조하세요.
오픈 소스 스크립트
트레이딩뷰의 진정한 정신에 따라, 이 스크립트의 작성자는 이를 오픈소스로 공개하여 트레이더들이 기능을 검토하고 검증할 수 있도록 했습니다. 작성자에게 찬사를 보냅니다! 이 코드는 무료로 사용할 수 있지만, 코드를 재게시하는 경우 하우스 룰이 적용된다는 점을 기억하세요.
면책사항
해당 정보와 게시물은 금융, 투자, 트레이딩 또는 기타 유형의 조언이나 권장 사항으로 간주되지 않으며, 트레이딩뷰에서 제공하거나 보증하는 것이 아닙니다. 자세한 내용은 이용 약관을 참조하세요.