OPEN-SOURCE SCRIPT
업데이트됨 Bullish Kicker
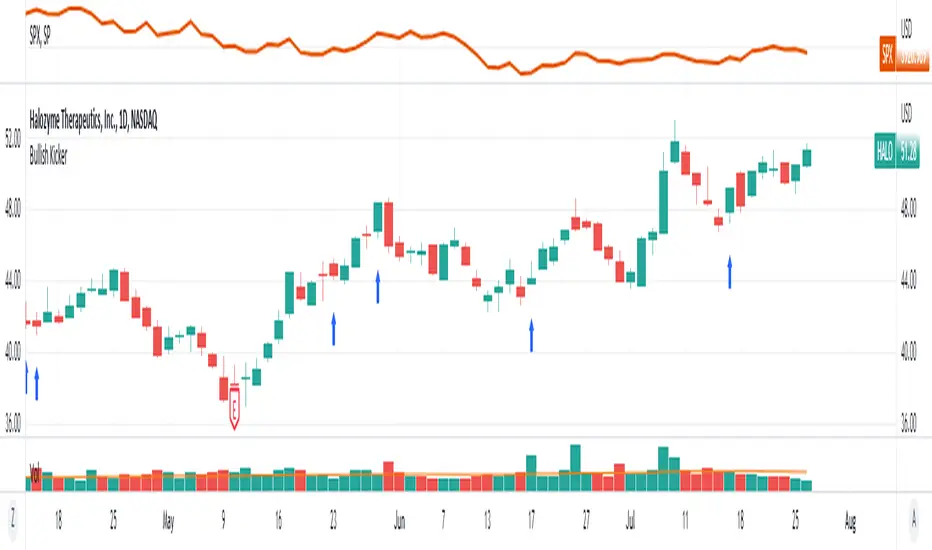
Identify bullish kicker candles on the chart. A bullish kicker candle occurs when the opening price is above the body of the previous candle. The previous candle must close lower than the open to qualify.
Indicator Settings
You can chose which shape and color to plot when a kicker candle occurs, as well as placement above, below or in a separate pane.
Bullish Kickers are indicated by blue arrows on the chart

Indicator Settings
You can chose which shape and color to plot when a kicker candle occurs, as well as placement above, below or in a separate pane.
Bullish Kickers are indicated by blue arrows on the chart
릴리즈 노트
Update fixes the overlay to be on the chart first, rather than a pane below릴리즈 노트
Fixes plot location to be below bars by default릴리즈 노트
Options to show only kickers where the opening price is the low of the day.릴리즈 노트
code clean up릴리즈 노트
Added the option to require a minimum gap amount to the kicker릴리즈 노트
Fixed a bug found in previous version오픈 소스 스크립트
트레이딩뷰의 진정한 정신에 따라, 이 스크립트의 작성자는 이를 오픈소스로 공개하여 트레이더들이 기능을 검토하고 검증할 수 있도록 했습니다. 작성자에게 찬사를 보냅니다! 이 코드는 무료로 사용할 수 있지만, 코드를 재게시하는 경우 하우스 룰이 적용된다는 점을 기억하세요.
Trusted Pine programmer. Send me a message for script development.
면책사항
해당 정보와 게시물은 금융, 투자, 트레이딩 또는 기타 유형의 조언이나 권장 사항으로 간주되지 않으며, 트레이딩뷰에서 제공하거나 보증하는 것이 아닙니다. 자세한 내용은 이용 약관을 참조하세요.
오픈 소스 스크립트
트레이딩뷰의 진정한 정신에 따라, 이 스크립트의 작성자는 이를 오픈소스로 공개하여 트레이더들이 기능을 검토하고 검증할 수 있도록 했습니다. 작성자에게 찬사를 보냅니다! 이 코드는 무료로 사용할 수 있지만, 코드를 재게시하는 경우 하우스 룰이 적용된다는 점을 기억하세요.
Trusted Pine programmer. Send me a message for script development.
면책사항
해당 정보와 게시물은 금융, 투자, 트레이딩 또는 기타 유형의 조언이나 권장 사항으로 간주되지 않으며, 트레이딩뷰에서 제공하거나 보증하는 것이 아닙니다. 자세한 내용은 이용 약관을 참조하세요.