PROTECTED SOURCE SCRIPT
Daily RVOL (Cumulative with Multi Alerts)
Daily RVOL (Cumulative with Multi Alerts)
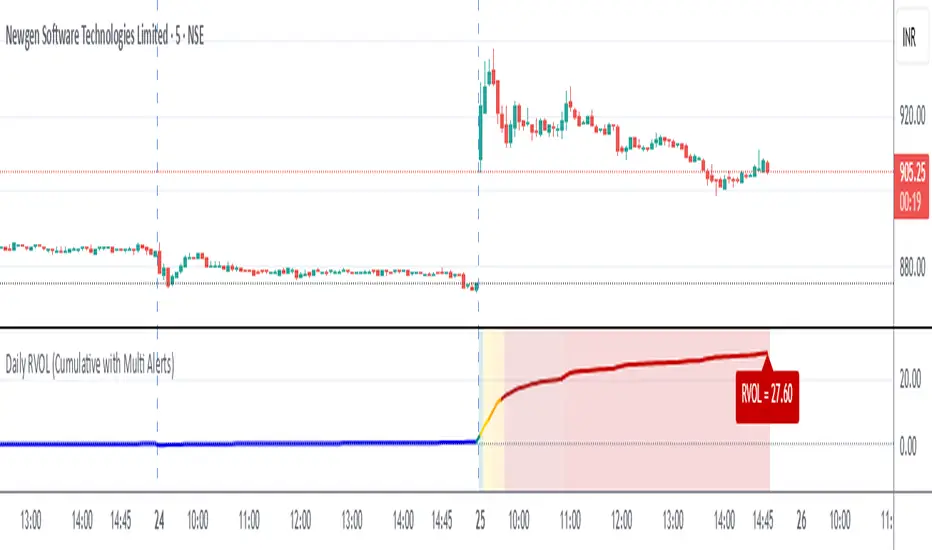
This indicator plots Relative Volume (RVOL) on intraday charts by comparing today’s cumulative traded volume with either:
The average daily volume of the past N days (default 5), or
Yesterday’s total daily volume (selectable from settings).
Unlike per-candle RVOL indicators, this version tracks cumulative intraday RVOL that only increases throughout the trading day. This matches how professional scanners (like Chartink/Gocharting) calculate RVOL, e.g. RVOL = 6 at open → 12 → 20 → 45 by end of day.
보호된 스크립트입니다
이 스크립트는 비공개 소스로 게시됩니다. 하지만 이를 자유롭게 제한 없이 사용할 수 있습니다 – 자세한 내용은 여기에서 확인하세요.
면책사항
해당 정보와 게시물은 금융, 투자, 트레이딩 또는 기타 유형의 조언이나 권장 사항으로 간주되지 않으며, 트레이딩뷰에서 제공하거나 보증하는 것이 아닙니다. 자세한 내용은 이용 약관을 참조하세요.
면책사항
해당 정보와 게시물은 금융, 투자, 트레이딩 또는 기타 유형의 조언이나 권장 사항으로 간주되지 않으며, 트레이딩뷰에서 제공하거나 보증하는 것이 아닙니다. 자세한 내용은 이용 약관을 참조하세요.