OPEN-SOURCE SCRIPT
업데이트됨 PSAR-Support Resistance

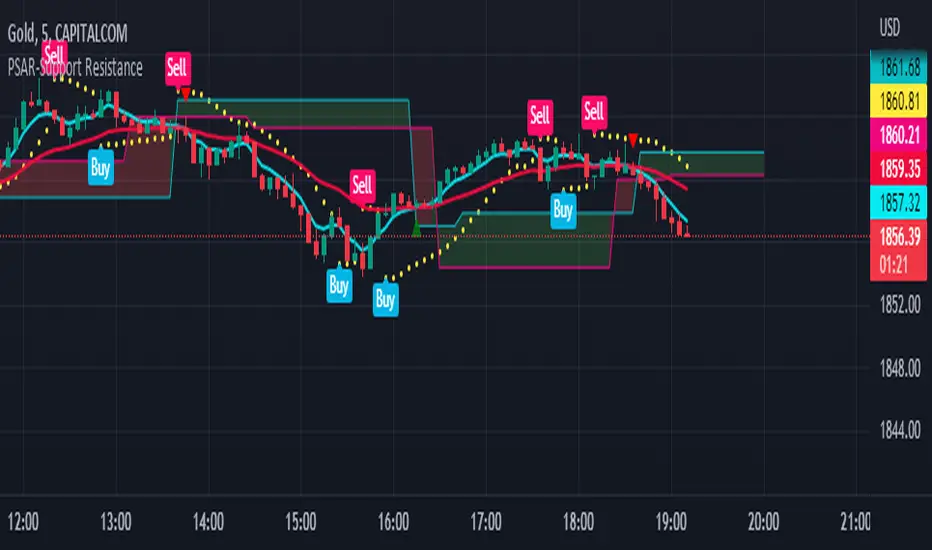
Parabolic Support Resistance -PSAR SR is based on the Dynamic Reversal Points of Price. This indicator eliminates the false signals of regular Parabolic SAR (Stop and Reverse). The Price of previous SAR Reversal point is plotted as Support and Resistance. The idea is to trade only after the previous reversal point is crossed and a new candle formation above / below the support resistance lines.
Price moves sideways in between the S/R Lines mostly.
Buy and Sell Signals are based on normal P-SAR settings however this S/R must be considered. Please be aware that the indicator cannot be used as a stand alone. Please make required confirmations before going into action.
Disclaimer: Please use it at your own Risk.
릴리즈 노트
Added AlertAdded MTF Support for SAR S/R
EMA Lines Plotted for Confirmations
릴리즈 노트
PSAR Cloud Support Resistance Enabled.* By Plotting SR lines by 10 candles, this SR Cloud acts as a Parabolic SAR S/R using previous 10 candles. Its easy to take trades in sideways market.
* During Sideways Candles swing between the Hi and Low of the Cloud.
* Plot from Higher Timeframe provides extra Support.
I have used offset=10 and timeframe=15 on a 5min chart for demonstration
*Avoid Trades when price moves into the cloud.
* Working is similar to inchimoku cloud. But here we use Parabolic SAR to provide dynamic support and resistance.
*stop loss can be placed below the candles first line of the cloud.
* take profit can be the projected cloud which acts as S/R
Please make sure you use HA candles that provides extra confirmation of trend
오픈 소스 스크립트
트레이딩뷰의 진정한 정신에 따라, 이 스크립트의 작성자는 이를 오픈소스로 공개하여 트레이더들이 기능을 검토하고 검증할 수 있도록 했습니다. 작성자에게 찬사를 보냅니다! 이 코드는 무료로 사용할 수 있지만, 코드를 재게시하는 경우 하우스 룰이 적용된다는 점을 기억하세요.
면책사항
해당 정보와 게시물은 금융, 투자, 트레이딩 또는 기타 유형의 조언이나 권장 사항으로 간주되지 않으며, 트레이딩뷰에서 제공하거나 보증하는 것이 아닙니다. 자세한 내용은 이용 약관을 참조하세요.
오픈 소스 스크립트
트레이딩뷰의 진정한 정신에 따라, 이 스크립트의 작성자는 이를 오픈소스로 공개하여 트레이더들이 기능을 검토하고 검증할 수 있도록 했습니다. 작성자에게 찬사를 보냅니다! 이 코드는 무료로 사용할 수 있지만, 코드를 재게시하는 경우 하우스 룰이 적용된다는 점을 기억하세요.
면책사항
해당 정보와 게시물은 금융, 투자, 트레이딩 또는 기타 유형의 조언이나 권장 사항으로 간주되지 않으며, 트레이딩뷰에서 제공하거나 보증하는 것이 아닙니다. 자세한 내용은 이용 약관을 참조하세요.