OPEN-SOURCE SCRIPT
[naoligo] Didi's Needle - Agulhada do Didi
EN-US
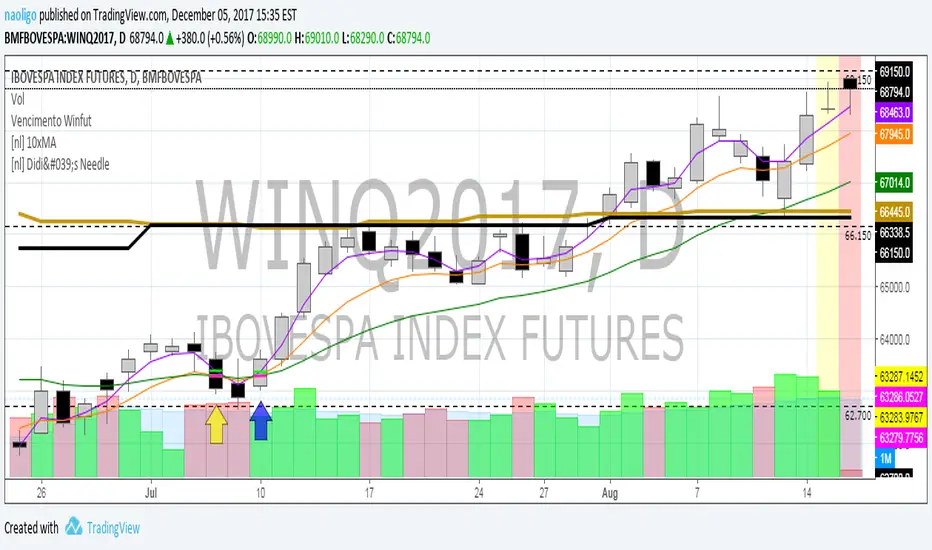
This indicator was created based on the famous 'Agulhada do Didi', created by the mythological Odir Aguiar. It has a very simple operation and can be applied in any graphical time, but the idea is that the longer the time, the better, following the classical Technical Analysis, that trends in larger graph times are stronger.
The candles are duly marked by arrows indicating the possible direction of the movement, being yellow when it is preparation and blue (bullish) or oranges (bearish). Moving averages are plotted only in such candles, to serve for analysis of their positions.
Comment if you have any questions, criticisms or suggestions.
Have fun!
=======================================================
PT-BR
Esse indicador foi criado com base na famosa 'Agulhada do Didi', criada pelo mitológico Odir Aguiar. Possui funcionamento bem simples e pode ser aplicado em qualquer tempo gráfico, mas a idéia é que quanto maior for o tempo, melhor, seguindo a Análise Técnica clássica, de que tendências em tempos gráficos maiores são mais fortes.
Os candles são devidamente marcados por setas indicando a possível direção do movimento, sendo amarelas quando for preparação e azuis ( bullish ) ou laranjas ( bearish ). As médias móveis são plotadas apenas em tais candles, pra servir para análise de suas posições.
Comentem caso tenham qualquer dúvida, crítica ou sugestão.
Divirtam-se!
오픈 소스 스크립트
트레이딩뷰의 진정한 정신에 따라, 이 스크립트의 작성자는 이를 오픈소스로 공개하여 트레이더들이 기능을 검토하고 검증할 수 있도록 했습니다. 작성자에게 찬사를 보냅니다! 이 코드는 무료로 사용할 수 있지만, 코드를 재게시하는 경우 하우스 룰이 적용된다는 점을 기억하세요.
면책사항
해당 정보와 게시물은 금융, 투자, 트레이딩 또는 기타 유형의 조언이나 권장 사항으로 간주되지 않으며, 트레이딩뷰에서 제공하거나 보증하는 것이 아닙니다. 자세한 내용은 이용 약관을 참조하세요.
오픈 소스 스크립트
트레이딩뷰의 진정한 정신에 따라, 이 스크립트의 작성자는 이를 오픈소스로 공개하여 트레이더들이 기능을 검토하고 검증할 수 있도록 했습니다. 작성자에게 찬사를 보냅니다! 이 코드는 무료로 사용할 수 있지만, 코드를 재게시하는 경우 하우스 룰이 적용된다는 점을 기억하세요.
면책사항
해당 정보와 게시물은 금융, 투자, 트레이딩 또는 기타 유형의 조언이나 권장 사항으로 간주되지 않으며, 트레이딩뷰에서 제공하거나 보증하는 것이 아닙니다. 자세한 내용은 이용 약관을 참조하세요.