PROTECTED SOURCE SCRIPT
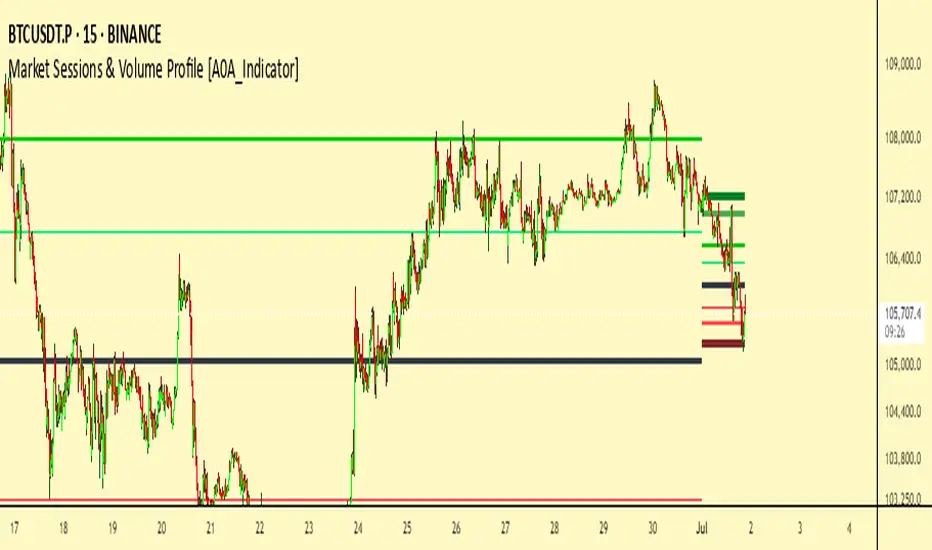
Market Sessions & Volume Profile [A0A_Indicator]
Description:
This advanced chart overlay is designed for traders who want maximum clarity in price formation and market structure. The tool visualizes the true market activity within individual sessions using multi-zonal approaches. It offers highly distinctive levels for both historically relevant and real-time trading ranges, all in a dynamic, adaptive visual structure.
What makes it unique:
Multiple layered price acceptance areas: Several tiers of market activity are shown, with each zone individually highlighted for optimal pattern recognition.
Session-adaptive boundaries: The displayed ranges adjust automatically depending on the trading session you select, for optimal relevance.
Precision liquidity markers: A central focus level is always marked and stands out clearly against the chart background.
Real-time adaptive: The profile responds immediately as new market data arrives, providing up-to-date structure and context.
Visual customization: All graphical features can be shown or hidden to match your personal analytical style.
Who should use this:
Anyone seeking to identify genuine value consensus, rejection extremes, and price memory zones within global trading hours—whether for intraday or swing analysis.
보호된 스크립트입니다
이 스크립트는 비공개 소스로 게시됩니다. 하지만 이를 자유롭게 제한 없이 사용할 수 있습니다 – 자세한 내용은 여기에서 확인하세요.
면책사항
해당 정보와 게시물은 금융, 투자, 트레이딩 또는 기타 유형의 조언이나 권장 사항으로 간주되지 않으며, 트레이딩뷰에서 제공하거나 보증하는 것이 아닙니다. 자세한 내용은 이용 약관을 참조하세요.
보호된 스크립트입니다
이 스크립트는 비공개 소스로 게시됩니다. 하지만 이를 자유롭게 제한 없이 사용할 수 있습니다 – 자세한 내용은 여기에서 확인하세요.
면책사항
해당 정보와 게시물은 금융, 투자, 트레이딩 또는 기타 유형의 조언이나 권장 사항으로 간주되지 않으며, 트레이딩뷰에서 제공하거나 보증하는 것이 아닙니다. 자세한 내용은 이용 약관을 참조하세요.