INVITE-ONLY SCRIPT
Witchcraft
This indicator has been in the works for a very long time, and it's finally ready for release. I present to you, Witchcraft.
There are many uses to this indicator and it will work on any timeframe. It was designed with cryptocurrency markets in mind but you may see success with forex, stocks, or even futures. Best used in a trending market combined with RSAR.
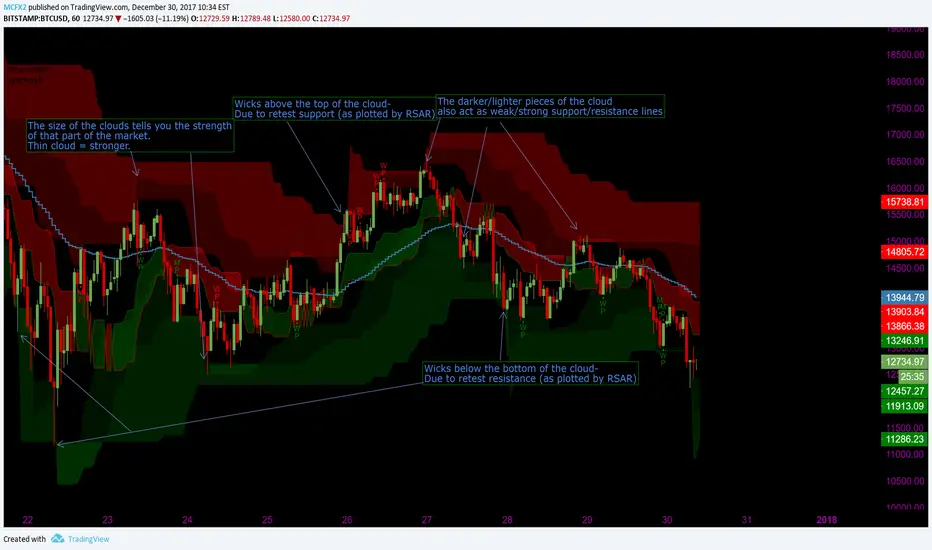
Witchcraft plots two clouds, a red cloud above the price and a green cloud below the price, which indicate support/resistance levels. These clouds are leading, meaning they are known before the price actually reaches that point in time. If you are making a short-term play, then you can identify potential entries/exits ahead of time by looking at the clouds for a longer timeframe.
The clouds will work with Renko charts and Heikin Ashis, but it was designed with regular candlesticks in mind.
Witchcraft can also help you gauge the strength of both sides of the market. The weaker they are, the bigger their cloud (counter-intuitive, i know). This means when you see a very thin buy cloud, it's a good time to look for an entry on a long position (such as inside the buy cloud).
Witchcraft also can replace Bollinger Bands, specifically their sell/buy-zone functions and their ability to predict large price movements. That is, just like on Bollinger Bands, Witchcraft bands will tighten as a big move approaches.
In a strong bear market, you are likely to see the price move in between the green cloud and the RSAR resistance line. Inversely,in a strong bull market most of the price action should occur between the red cloud and the RSAR support line.
Witchcraft, RSAR, and Whale Movement combine to be a very powerful asset. However, no matter what kind of trade setup you prefer, Witchcraft is a powerful tool.
Due to the versatility of this indicator, it can also replace a lot of common indicators and make your charts cleaner. It can take the place of ichimokou cloud, bollinger bands, and even stochrsi/rsi (as there's no longer a need to identify overbought/oversold levels when you can just use the cloud).
On a long position, ideal take-profit points are at the 3 resistances plotted, or potentially the RSAR reversal/support lines depending on where the price is when you enter. On a short position, the ideal exits are obviously the 3 plotted supports.
Good stoplosses are given by RSAR, again depending on where the price is and where your position is. Setting stoplosses based off of Witchcraft is silly since it signals for reversals, so you'd likely get stopped out at the worst possible time.
There are many uses to this indicator and it will work on any timeframe. It was designed with cryptocurrency markets in mind but you may see success with forex, stocks, or even futures. Best used in a trending market combined with RSAR.
Witchcraft plots two clouds, a red cloud above the price and a green cloud below the price, which indicate support/resistance levels. These clouds are leading, meaning they are known before the price actually reaches that point in time. If you are making a short-term play, then you can identify potential entries/exits ahead of time by looking at the clouds for a longer timeframe.
The clouds will work with Renko charts and Heikin Ashis, but it was designed with regular candlesticks in mind.
Witchcraft can also help you gauge the strength of both sides of the market. The weaker they are, the bigger their cloud (counter-intuitive, i know). This means when you see a very thin buy cloud, it's a good time to look for an entry on a long position (such as inside the buy cloud).
Witchcraft also can replace Bollinger Bands, specifically their sell/buy-zone functions and their ability to predict large price movements. That is, just like on Bollinger Bands, Witchcraft bands will tighten as a big move approaches.
In a strong bear market, you are likely to see the price move in between the green cloud and the RSAR resistance line. Inversely,in a strong bull market most of the price action should occur between the red cloud and the RSAR support line.
Witchcraft, RSAR, and Whale Movement combine to be a very powerful asset. However, no matter what kind of trade setup you prefer, Witchcraft is a powerful tool.
Due to the versatility of this indicator, it can also replace a lot of common indicators and make your charts cleaner. It can take the place of ichimokou cloud, bollinger bands, and even stochrsi/rsi (as there's no longer a need to identify overbought/oversold levels when you can just use the cloud).
On a long position, ideal take-profit points are at the 3 resistances plotted, or potentially the RSAR reversal/support lines depending on where the price is when you enter. On a short position, the ideal exits are obviously the 3 plotted supports.
Good stoplosses are given by RSAR, again depending on where the price is and where your position is. Setting stoplosses based off of Witchcraft is silly since it signals for reversals, so you'd likely get stopped out at the worst possible time.
초대 전용 스크립트
이 스크립트는 작성자가 승인한 사용자만 접근할 수 있습니다. 사용하려면 요청 후 승인을 받아야 하며, 일반적으로 결제 후에 허가가 부여됩니다. 자세한 내용은 아래 작성자의 안내를 따르거나 MCFX2에게 직접 문의하세요.
트레이딩뷰는 스크립트의 작동 방식을 충분히 이해하고 작성자를 완전히 신뢰하지 않는 이상, 해당 스크립트에 비용을 지불하거나 사용하는 것을 권장하지 않습니다. 커뮤니티 스크립트에서 무료 오픈소스 대안을 찾아보실 수도 있습니다.
작성자 지시 사항
면책사항
해당 정보와 게시물은 금융, 투자, 트레이딩 또는 기타 유형의 조언이나 권장 사항으로 간주되지 않으며, 트레이딩뷰에서 제공하거나 보증하는 것이 아닙니다. 자세한 내용은 이용 약관을 참조하세요.