OPEN-SOURCE SCRIPT
Initial Balance Breakout + Fib
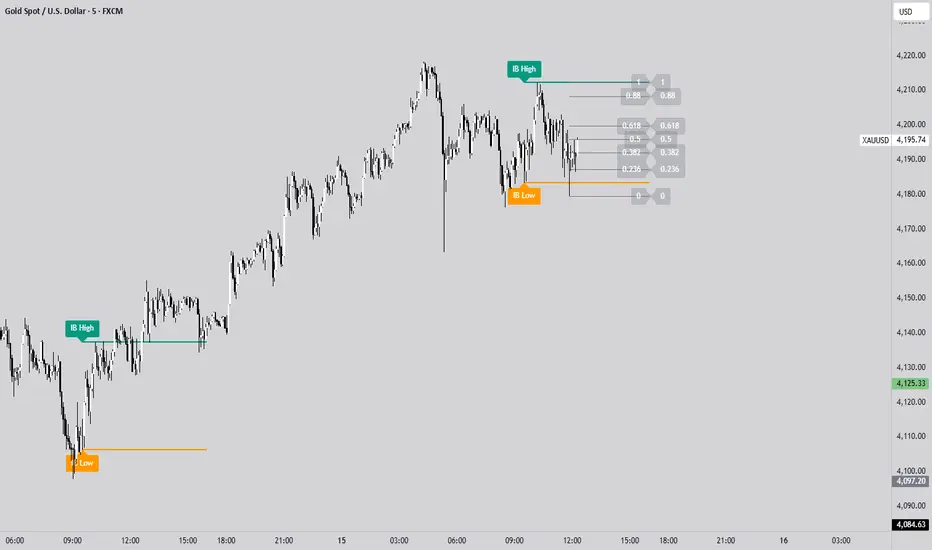
The IB High / Low + Auto-Fib indicator automatically plots the Initial Balance range and a Fibonacci projection for each trading day.
Define your IB start and end times (e.g., 09:30–10:30).
The indicator marks the IB High and IB Low from that session and extends them to the session close.
It keeps the last N days visible for context.
When price breaks outside the IB range, it automatically plots a Fibonacci retracement/extension from the opposite IB side to the breakout, using levels 0, 0.236, 0.382, 0.5, 0.618, 0.88, 1.
The Fib updates dynamically as the breakout extends, and labels are neatly aligned on the right side of the chart for clarity.
Ideal for traders who monitor Initial Balance breaks, range expansions, and Fibonacci reaction levels throughout the trading session.
오픈 소스 스크립트
진정한 트레이딩뷰 정신에 따라 이 스크립트 작성자는 트레이더가 기능을 검토하고 검증할 수 있도록 오픈소스로 공개했습니다. 작성자에게 찬사를 보냅니다! 무료로 사용할 수 있지만 코드를 다시 게시할 경우 하우스 룰이 적용된다는 점을 기억하세요.
면책사항
이 정보와 게시물은 TradingView에서 제공하거나 보증하는 금융, 투자, 거래 또는 기타 유형의 조언이나 권고 사항을 의미하거나 구성하지 않습니다. 자세한 내용은 이용 약관을 참고하세요.
오픈 소스 스크립트
진정한 트레이딩뷰 정신에 따라 이 스크립트 작성자는 트레이더가 기능을 검토하고 검증할 수 있도록 오픈소스로 공개했습니다. 작성자에게 찬사를 보냅니다! 무료로 사용할 수 있지만 코드를 다시 게시할 경우 하우스 룰이 적용된다는 점을 기억하세요.
면책사항
이 정보와 게시물은 TradingView에서 제공하거나 보증하는 금융, 투자, 거래 또는 기타 유형의 조언이나 권고 사항을 의미하거나 구성하지 않습니다. 자세한 내용은 이용 약관을 참고하세요.