PROTECTED SOURCE SCRIPT
Z-Score Indicator
What it does:
Key Features:
Reference Lines:
How to use it:
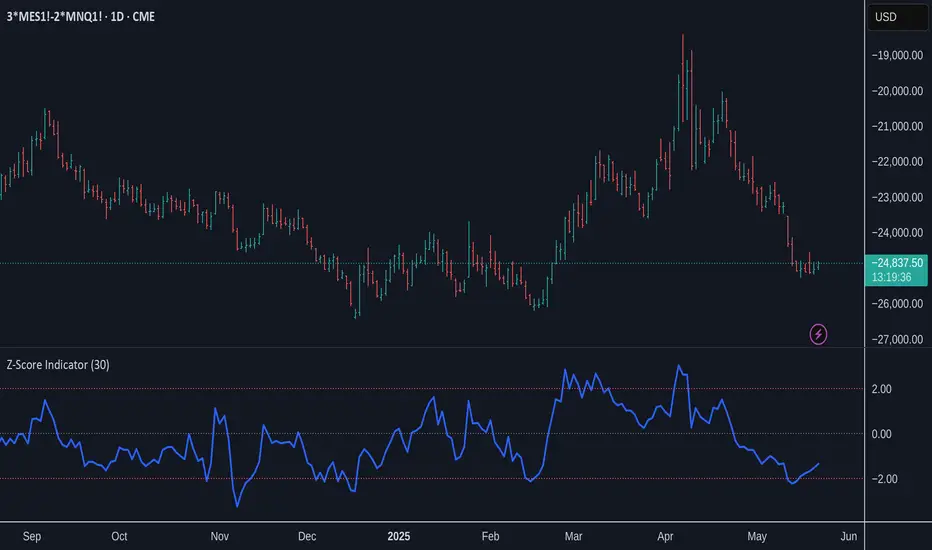
- Calculates the Z-Score: (Current Price - Average Price) / Standard Deviation
- Plots the Z-Score in a separate panel below your main chart.
- Allows you to customize the Lookback Period (default is 30 bars) to suit your trading style and the asset's characteristics. A shorter period is more sensitive, while a longer period provides a smoother output.
Key Features:
- Clear Z-Score Line: Visualizes the current Z-Score value.
Reference Lines:
- Zero Line (Gray, Dotted): Indicates the price is at its average for the lookback period.
- +2 Standard Deviations (Red, Dotted): Highlights when the price is significantly above its recent average. Often interpreted as potentially overbought.
- -2 Standard Deviations (Red, Dotted): Highlights when the price is significantly below its recent average. Often interpreted as potentially oversold.
How to use it:
- Look for Z-Score values moving towards or beyond the +2 or -2 standard deviation lines. These extremes can signal that the price has moved unusually far from its mean and might be due for a reversion or a pause.
- Use it in conjunction with other indicators and your overall market analysis to make more informed trading decisions.
- Experiment with the "Lookback Period" setting to find what works best for different assets and timeframes.
보호된 스크립트입니다
이 스크립트는 비공개 소스로 게시됩니다. 하지만 이를 자유롭게 제한 없이 사용할 수 있습니다 – 자세한 내용은 여기에서 확인하세요.
면책사항
해당 정보와 게시물은 금융, 투자, 트레이딩 또는 기타 유형의 조언이나 권장 사항으로 간주되지 않으며, 트레이딩뷰에서 제공하거나 보증하는 것이 아닙니다. 자세한 내용은 이용 약관을 참조하세요.
보호된 스크립트입니다
이 스크립트는 비공개 소스로 게시됩니다. 하지만 이를 자유롭게 제한 없이 사용할 수 있습니다 – 자세한 내용은 여기에서 확인하세요.
면책사항
해당 정보와 게시물은 금융, 투자, 트레이딩 또는 기타 유형의 조언이나 권장 사항으로 간주되지 않으며, 트레이딩뷰에서 제공하거나 보증하는 것이 아닙니다. 자세한 내용은 이용 약관을 참조하세요.