OPEN-SOURCE SCRIPT
Price and Indicator Correlation
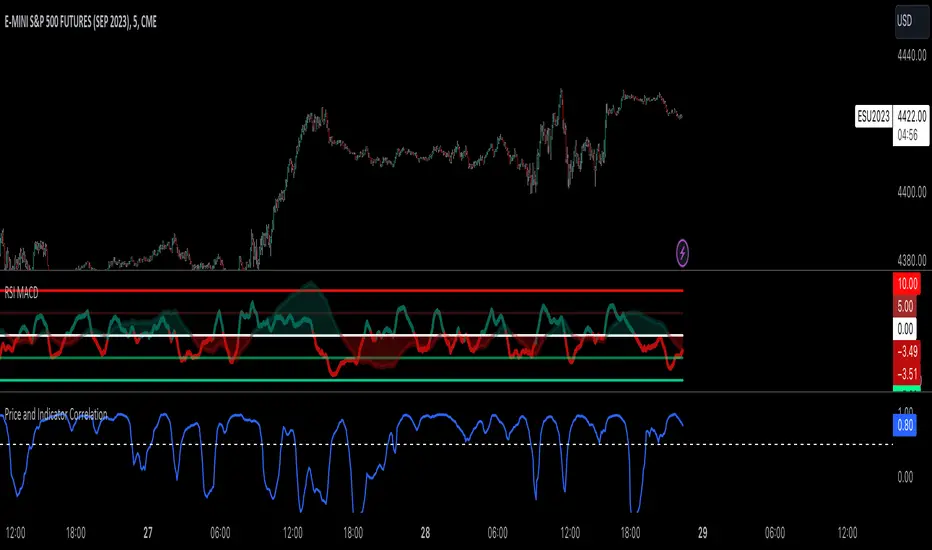
FIRST, CHANGE SOURCE OF INDICATOR FROM CLOSE TO WHATEVER INDICATOR YOU ARE COMPARING TO PRICE!!!!
Confirming Indicator Validity: By calculating the correlation coefficient between the price and a specific indicator, you can assess the degree to which the indicator and price move together. If there is a high positive correlation, it suggests that the indicator tends to move in the same direction as the price, increasing confidence in the indicator's validity. On the other hand, a low or negative correlation may indicate a weaker relationship between the indicator and price, signaling caution in relying solely on that indicator for trading decisions.
Identifying Divergence: Divergence occurs when the price and the indicator move in opposite directions. By monitoring the correlation coefficient, you can identify periods of divergence between the price and the selected indicator. Divergence may signal a potential reversal or significant price move, providing an opportunity to enter or exit trades.
Enhancing Trading Strategies: The correlation coefficient can be used to enhance trading strategies by incorporating the relationship between the price and the indicator. For example, if the correlation coefficient consistently shows a strong positive correlation, you may use the indicator as a confirmation tool for price-based trading signals. Conversely, if the correlation is consistently negative, it may indicate an inverse relationship that could be used for contrarian trading strategies.
Indicator Optimization: The correlation coefficient can help traders compare the effectiveness of different indicators. By calculating the correlation coefficient for multiple indicators against the price, you can identify which indicators have a stronger or weaker relationship with price movements. This information can guide the selection and optimization of indicators in your trading strategy.
Example:
오픈 소스 스크립트
트레이딩뷰의 진정한 정신에 따라, 이 스크립트의 작성자는 이를 오픈소스로 공개하여 트레이더들이 기능을 검토하고 검증할 수 있도록 했습니다. 작성자에게 찬사를 보냅니다! 이 코드는 무료로 사용할 수 있지만, 코드를 재게시하는 경우 하우스 룰이 적용된다는 점을 기억하세요.
면책사항
해당 정보와 게시물은 금융, 투자, 트레이딩 또는 기타 유형의 조언이나 권장 사항으로 간주되지 않으며, 트레이딩뷰에서 제공하거나 보증하는 것이 아닙니다. 자세한 내용은 이용 약관을 참조하세요.
오픈 소스 스크립트
트레이딩뷰의 진정한 정신에 따라, 이 스크립트의 작성자는 이를 오픈소스로 공개하여 트레이더들이 기능을 검토하고 검증할 수 있도록 했습니다. 작성자에게 찬사를 보냅니다! 이 코드는 무료로 사용할 수 있지만, 코드를 재게시하는 경우 하우스 룰이 적용된다는 점을 기억하세요.
면책사항
해당 정보와 게시물은 금융, 투자, 트레이딩 또는 기타 유형의 조언이나 권장 사항으로 간주되지 않으며, 트레이딩뷰에서 제공하거나 보증하는 것이 아닙니다. 자세한 내용은 이용 약관을 참조하세요.