OPEN-SOURCE SCRIPT
업데이트됨 Bogdan Ciocoiu - Looking Glass
► Description
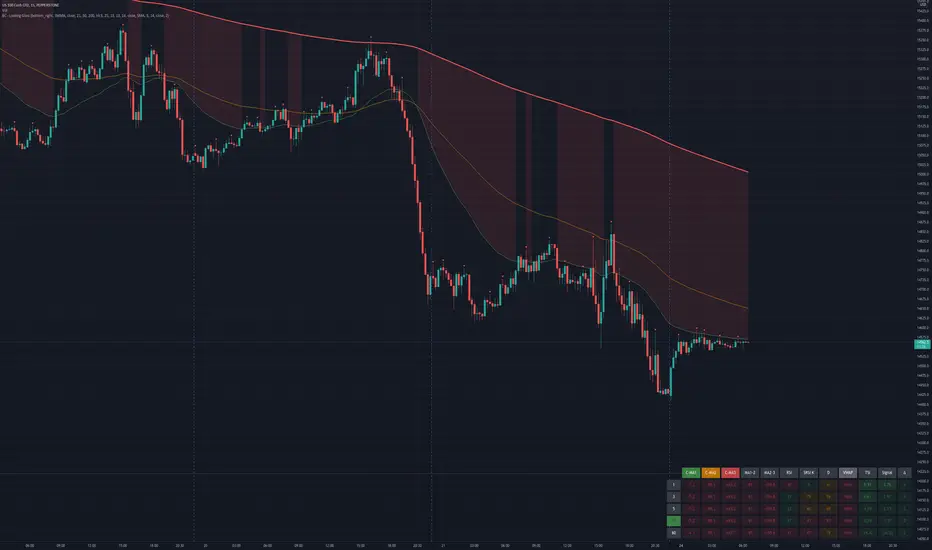
The script shows a multi-timeline suite of information for the current ticker. This information refers to configurable moving averages, RSI, Stochastic RSI, VWAP and TSI data. The timeframes reflected in the script vary from 1m to 1h. I recommend the tool for 3m scalping as it provides good visibility upwards.
The headings from the table are:
► Originality and usefulness
This tool is helpful because it helps users read a chart much quicker than if they were to navigate between timeframes. The colour coding indicates an accident/descendant trend between any two values (i.e. close vs MA1, MA1-MA2, RSI K vs RSI D, etc.).
► Open-source reuse
tradingview.com/support/solutions/43000502589-moving-average/
tradingview.com/support/solutions/43000502338-relative-strength-index-rsi/
tradingview.com/support/solutions/43000502333-stochastic-rsi-stoch-rsi/
tradingview.com/support/solutions/43000502018-volume-weighted-average-price-vwap/
tradingview.com/support/solutions/43000592290-true-strength-indicator/
The script shows a multi-timeline suite of information for the current ticker. This information refers to configurable moving averages, RSI, Stochastic RSI, VWAP and TSI data. The timeframes reflected in the script vary from 1m to 1h. I recommend the tool for 3m scalping as it provides good visibility upwards.
The headings from the table are:
- {Close} - {MA1}
- {Close} - {MA2}
- {Close} - {MA3}
- {MA1} - {MA2}
- {MA2} - {MA3}
- {RSI}
- {Stoch RSI K}
- {Stoch RSI D}
- {VWAP}
- {TSI}
- {TSI EMA}
- {TSI} - {TSI EMA}
► Originality and usefulness
This tool is helpful because it helps users read a chart much quicker than if they were to navigate between timeframes. The colour coding indicates an accident/descendant trend between any two values (i.e. close vs MA1, MA1-MA2, RSI K vs RSI D, etc.).
► Open-source reuse
tradingview.com/support/solutions/43000502589-moving-average/
tradingview.com/support/solutions/43000502338-relative-strength-index-rsi/
tradingview.com/support/solutions/43000502333-stochastic-rsi-stoch-rsi/
tradingview.com/support/solutions/43000502018-volume-weighted-average-price-vwap/
tradingview.com/support/solutions/43000592290-true-strength-indicator/
릴리즈 노트
This tool now offers additional features such as managing which columns are being shown, making it more suitable for tablets and devices with limited screen estate.릴리즈 노트
// Original Description// The script shows a multi-timeline suite of information for the current ticker. This information refers to configurable moving averages, RSI, Stochastic RSI, VWAP and TSI data. The timeframes reflected in the script vary from 1m to 1h. I recommend the tool for 3m scalping as it provides good visibility upwards.
// This is the updated version of the original script. Special thanks to SamAccountX for the support.
// Major updates compared to the v1 version include:
// - Being able to change the style of the lines, including width and colour
// - Being able to show/hide the table or specific columns/rows from within
// - Improvements in terms of naming the plots and shapes to ease traceability and managing settings
// - Optimised the previous revision by reducing the number of "request.security" calls, improving load and allowing room for more feature functionalities.
// - Allows repositioning the table subject to screen size and shape to suit the diverse type of terminals out there
오픈 소스 스크립트
트레이딩뷰의 진정한 정신에 따라, 이 스크립트의 작성자는 이를 오픈소스로 공개하여 트레이더들이 기능을 검토하고 검증할 수 있도록 했습니다. 작성자에게 찬사를 보냅니다! 이 코드는 무료로 사용할 수 있지만, 코드를 재게시하는 경우 하우스 룰이 적용된다는 점을 기억하세요.
면책사항
해당 정보와 게시물은 금융, 투자, 트레이딩 또는 기타 유형의 조언이나 권장 사항으로 간주되지 않으며, 트레이딩뷰에서 제공하거나 보증하는 것이 아닙니다. 자세한 내용은 이용 약관을 참조하세요.
오픈 소스 스크립트
트레이딩뷰의 진정한 정신에 따라, 이 스크립트의 작성자는 이를 오픈소스로 공개하여 트레이더들이 기능을 검토하고 검증할 수 있도록 했습니다. 작성자에게 찬사를 보냅니다! 이 코드는 무료로 사용할 수 있지만, 코드를 재게시하는 경우 하우스 룰이 적용된다는 점을 기억하세요.
면책사항
해당 정보와 게시물은 금융, 투자, 트레이딩 또는 기타 유형의 조언이나 권장 사항으로 간주되지 않으며, 트레이딩뷰에서 제공하거나 보증하는 것이 아닙니다. 자세한 내용은 이용 약관을 참조하세요.