INVITE-ONLY SCRIPT
Ichimoku Trader Toolkit
The Ichimoku Cloud
is a collection of technical indicators that show support and resistance levels, as well as momentum and trend direction. It does this by taking multiple averages and plotting them on the chart. It also uses these figures to compute a "cloud" which attempts to forecast where the price may find support or resistance in the future. The Ichimoku cloud was developed by Goichi Hosoda, a Japanese journalist, and published in the late 1960s.
It provides more data points than the standard candlestick chart. While it seems complicated at first glance, those familiar with how to read the charts often find it easy to understand with well-defined trading signals.
The Ichimoku Cloud is useful for day traders and others who need to make quick decisions. The cloud is often paired with other technical indicators, such as the Relative Strength Index , in order for traders to get a complete picture of resistance and support. Many traders will also look out for crossovers in order to determine when trends have reversed.
Ichimoku cloud trading requires a lot of self-discipline. This is because you have to wait for the best trade signals.
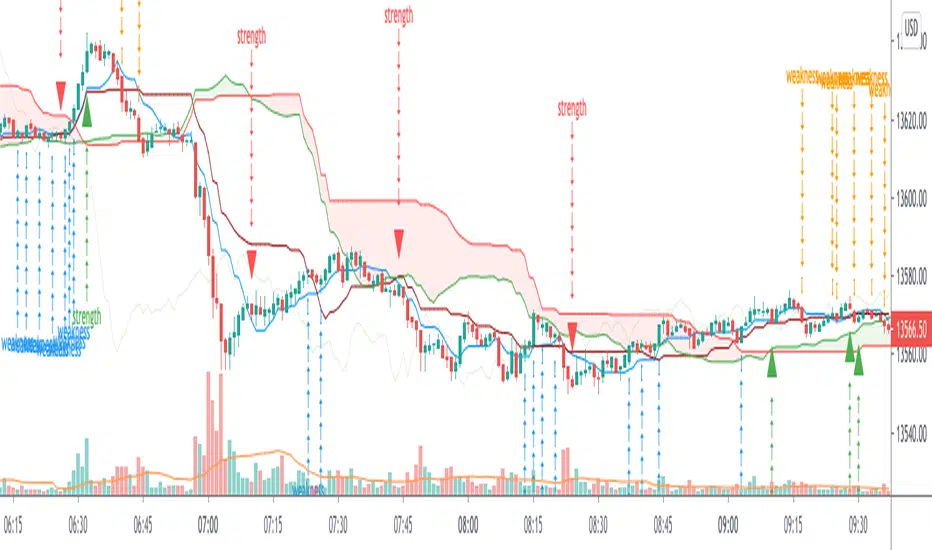
What is this Ichimoku Trader Toolkit ?
Since Ichimoku is a reliable Indicator, but its very populated on charts, Its bit complicated to find the Sign of Strength {SOS} and Sign of Weaknesses {SOW} at first glance,
The Toolkit is an attempt to make Ichimoku much more Intutive to trade and visualize the potential SOS and SOW early in the charts
What timeframes can it be used?
Any Timeframe
Provision for Alerts
Strength_alerts
Weakness_alerts
All_Alerts
How can you get access?
Private message me only, use comment box for constructive comments
is a collection of technical indicators that show support and resistance levels, as well as momentum and trend direction. It does this by taking multiple averages and plotting them on the chart. It also uses these figures to compute a "cloud" which attempts to forecast where the price may find support or resistance in the future. The Ichimoku cloud was developed by Goichi Hosoda, a Japanese journalist, and published in the late 1960s.
It provides more data points than the standard candlestick chart. While it seems complicated at first glance, those familiar with how to read the charts often find it easy to understand with well-defined trading signals.
The Ichimoku Cloud is useful for day traders and others who need to make quick decisions. The cloud is often paired with other technical indicators, such as the Relative Strength Index , in order for traders to get a complete picture of resistance and support. Many traders will also look out for crossovers in order to determine when trends have reversed.
Ichimoku cloud trading requires a lot of self-discipline. This is because you have to wait for the best trade signals.
What is this Ichimoku Trader Toolkit ?
Since Ichimoku is a reliable Indicator, but its very populated on charts, Its bit complicated to find the Sign of Strength {SOS} and Sign of Weaknesses {SOW} at first glance,
The Toolkit is an attempt to make Ichimoku much more Intutive to trade and visualize the potential SOS and SOW early in the charts
What timeframes can it be used?
Any Timeframe
Provision for Alerts
Strength_alerts
Weakness_alerts
All_Alerts
How can you get access?
Private message me only, use comment box for constructive comments
초대 전용 스크립트
이 스크립트는 작성자가 승인한 사용자만 접근할 수 있습니다. 사용하려면 요청 후 승인을 받아야 하며, 일반적으로 결제 후에 허가가 부여됩니다. 자세한 내용은 아래 작성자의 안내를 따르거나 Ankit_1618에게 직접 문의하세요.
트레이딩뷰는 스크립트의 작동 방식을 충분히 이해하고 작성자를 완전히 신뢰하지 않는 이상, 해당 스크립트에 비용을 지불하거나 사용하는 것을 권장하지 않습니다. 커뮤니티 스크립트에서 무료 오픈소스 대안을 찾아보실 수도 있습니다.
작성자 지시 사항
Private message me only, use comment box for constructive comments
Get Ocs Ai Trader, Your personal Ai Trade Assistant here
→ ocstrader.com
About me
AlgoTrading Certification, ( University of Oxford, Säid Business School )
PGP Research Analysis, ( NISM, SEBI )
Electronics Engineer
→ ocstrader.com
About me
AlgoTrading Certification, ( University of Oxford, Säid Business School )
PGP Research Analysis, ( NISM, SEBI )
Electronics Engineer
면책사항
해당 정보와 게시물은 금융, 투자, 트레이딩 또는 기타 유형의 조언이나 권장 사항으로 간주되지 않으며, 트레이딩뷰에서 제공하거나 보증하는 것이 아닙니다. 자세한 내용은 이용 약관을 참조하세요.