OPEN-SOURCE SCRIPT
업데이트됨 Support and resistance zones
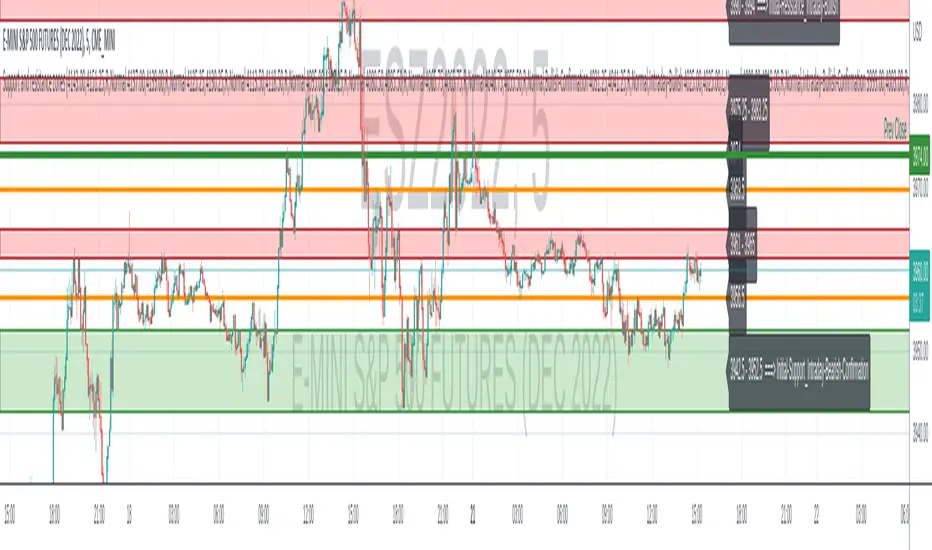
Discretionary traders often use support and resistance zones that are based on past price action of the instrument traded.
This simple script is used to plot support and resistance zones for a given instrument. The data for the zones themselves has to be determined by the past price action of the instrument and are not based on the provided data by Tradingview.
The zones input has to come as a string. Each zone consists of a string with: "<low(number)>,<high(number)>,<"S"|"R"|"L">,<"Normal"|"Strong">"" The different zone strings have to be seperated by either new line or space.
An example for the zones input looks like:
3919.25,3919.25,L,Normal
3897.50,3906.50,R,Normal
3891.00,3894.50,S,Strong
I appreciate any feedback.
릴리즈 노트
- fix the start-bar of the boxes- place labels after the last bar of the chart
릴리즈 노트
-Some more code clean-up-move start of the zone to start of the day
릴리즈 노트
Allow for optional comments in one zone string, for example "3868.00,3878.00,S,Normal,My-comment_without_space"릴리즈 노트
Fix label overlay on new bars.릴리즈 노트
Fix: move Labels on a new bar릴리즈 노트
Allow for zones boxes to be started some days back and not only today via input parameter.릴리즈 노트
Adjusted the labels to not be centered, but left.오픈 소스 스크립트
트레이딩뷰의 진정한 정신에 따라, 이 스크립트의 작성자는 이를 오픈소스로 공개하여 트레이더들이 기능을 검토하고 검증할 수 있도록 했습니다. 작성자에게 찬사를 보냅니다! 이 코드는 무료로 사용할 수 있지만, 코드를 재게시하는 경우 하우스 룰이 적용된다는 점을 기억하세요.
면책사항
해당 정보와 게시물은 금융, 투자, 트레이딩 또는 기타 유형의 조언이나 권장 사항으로 간주되지 않으며, 트레이딩뷰에서 제공하거나 보증하는 것이 아닙니다. 자세한 내용은 이용 약관을 참조하세요.
오픈 소스 스크립트
트레이딩뷰의 진정한 정신에 따라, 이 스크립트의 작성자는 이를 오픈소스로 공개하여 트레이더들이 기능을 검토하고 검증할 수 있도록 했습니다. 작성자에게 찬사를 보냅니다! 이 코드는 무료로 사용할 수 있지만, 코드를 재게시하는 경우 하우스 룰이 적용된다는 점을 기억하세요.
면책사항
해당 정보와 게시물은 금융, 투자, 트레이딩 또는 기타 유형의 조언이나 권장 사항으로 간주되지 않으며, 트레이딩뷰에서 제공하거나 보증하는 것이 아닙니다. 자세한 내용은 이용 약관을 참조하세요.