INVITE-ONLY SCRIPT
업데이트됨 Plutus eXploration Index - PXI
Greetings Fellow Traders!
We have developed this simple and easy to use indicator so that all users can benefit from it by:
• Reducing the amount of time spent trading.
• Minimizing the risk of loss.
• Accurate timing on entries and exits.
• Signals are accurate in volatile market conditions.
What is the PXI?
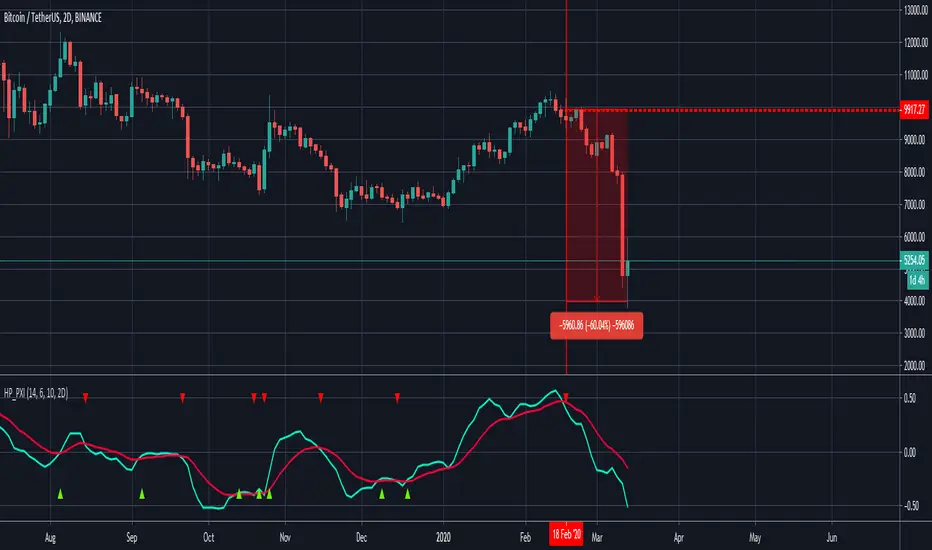
The Plutus eXploration Index falls under the centred momentum oscillator category which means that it fluctuates above and below a central point or line. Apex levels exist, where the indicator will reach a peak, and start moving in the opposite direction. Two lines move in unison and crossovers will signal a buy and a sell.
Setting up the indicator:
Once you have received your invite, the indicator will appear under your "my invite only" scripts in trading view detailed charts screen. Select PXI and add it to your chart. For free accounts on TradingView, the indicator limit is set to x3, so please de-activate something if you hit this limit.
You can access the PXI setting in the string of icons that follow after the indicators name in the top left corner of the indicator chart. In order:
Name | Visibility | Settings | Show source code | Delete | More
Under the settings, there are two tabs. One for the style, which you may freely change to suit your preferences. And then the first tab, for Inputs. The default settings for Long Minima, Short Maxima and Integrated EMA should not be changed.
The critical change to make in the input settings is the time frame!
The time frame on the price chart and the time frame on the indicator have to match! The range of allowable time frames is as follows:
15min | 30min | 1h | 4h | 12h | 1d | 2d | 1week
How to use the PXI:
The apex levels on the oscillator differ for each asset and vary depending on the selected time frame. The signals provided near apex points shall hold more weight. We recommend that traders assess these levels properly before considering a position.
Sell signal: Sell signals occur when the quick line (default blue) crosses over the slow line (default orange) from above.
A red arrow down will mark this point in time out on the chart.
Buy signal: Buy signals occur when the quick line (default blue) crosses the slow line (default orange) from bellow.
A green arrow down will mark this point in time out on the chart.
Maximizing Risk/Reward and profitability:
The indicator strives to keep positions open long enough to reap real rewards in the market. Maximum profit levels naturally occur around the apex points on the indicator chart, and the onus is on the trader to attempt an early exit once these levels are achieved.
Addition points to consider:
Most profitable trading signals occur on the daily time frames while considering the duration of trades and timing of the signals. For the lowest risk levels, weekly time frames are most suitable. From the weekly time frame down, the risk increases incrementally until you reach the 15min time frame. Signals at the lower levels occur more often and they are effective but, they should, however, be monitored closely. Also, the lower the time frame, the higher the chances of false-positive signals.
will not be liable for damages of any kind resulting from your use of or inability to use the indicator or content.
We have developed this simple and easy to use indicator so that all users can benefit from it by:
• Reducing the amount of time spent trading.
• Minimizing the risk of loss.
• Accurate timing on entries and exits.
• Signals are accurate in volatile market conditions.
What is the PXI?
The Plutus eXploration Index falls under the centred momentum oscillator category which means that it fluctuates above and below a central point or line. Apex levels exist, where the indicator will reach a peak, and start moving in the opposite direction. Two lines move in unison and crossovers will signal a buy and a sell.
Setting up the indicator:
Once you have received your invite, the indicator will appear under your "my invite only" scripts in trading view detailed charts screen. Select PXI and add it to your chart. For free accounts on TradingView, the indicator limit is set to x3, so please de-activate something if you hit this limit.
You can access the PXI setting in the string of icons that follow after the indicators name in the top left corner of the indicator chart. In order:
Name | Visibility | Settings | Show source code | Delete | More
Under the settings, there are two tabs. One for the style, which you may freely change to suit your preferences. And then the first tab, for Inputs. The default settings for Long Minima, Short Maxima and Integrated EMA should not be changed.
The critical change to make in the input settings is the time frame!
The time frame on the price chart and the time frame on the indicator have to match! The range of allowable time frames is as follows:
15min | 30min | 1h | 4h | 12h | 1d | 2d | 1week
How to use the PXI:
The apex levels on the oscillator differ for each asset and vary depending on the selected time frame. The signals provided near apex points shall hold more weight. We recommend that traders assess these levels properly before considering a position.
Sell signal: Sell signals occur when the quick line (default blue) crosses over the slow line (default orange) from above.
A red arrow down will mark this point in time out on the chart.
Buy signal: Buy signals occur when the quick line (default blue) crosses the slow line (default orange) from bellow.
A green arrow down will mark this point in time out on the chart.
Maximizing Risk/Reward and profitability:
The indicator strives to keep positions open long enough to reap real rewards in the market. Maximum profit levels naturally occur around the apex points on the indicator chart, and the onus is on the trader to attempt an early exit once these levels are achieved.
Addition points to consider:
Most profitable trading signals occur on the daily time frames while considering the duration of trades and timing of the signals. For the lowest risk levels, weekly time frames are most suitable. From the weekly time frame down, the risk increases incrementally until you reach the 15min time frame. Signals at the lower levels occur more often and they are effective but, they should, however, be monitored closely. Also, the lower the time frame, the higher the chances of false-positive signals.
will not be liable for damages of any kind resulting from your use of or inability to use the indicator or content.
릴리즈 노트
Time frame setting amendment 릴리즈 노트
Trading Chart Updated릴리즈 노트
Time frame adjustments초대 전용 스크립트
이 스크립트는 작성자가 승인한 사용자만 접근할 수 있습니다. 사용하려면 요청 후 승인을 받아야 하며, 일반적으로 결제 후에 허가가 부여됩니다. 자세한 내용은 아래 작성자의 안내를 따르거나 HashedPlutus에게 직접 문의하세요.
트레이딩뷰는 스크립트의 작동 방식을 충분히 이해하고 작성자를 완전히 신뢰하지 않는 이상, 해당 스크립트에 비용을 지불하거나 사용하는 것을 권장하지 않습니다. 커뮤니티 스크립트에서 무료 오픈소스 대안을 찾아보실 수도 있습니다.
작성자 지시 사항
면책사항
해당 정보와 게시물은 금융, 투자, 트레이딩 또는 기타 유형의 조언이나 권장 사항으로 간주되지 않으며, 트레이딩뷰에서 제공하거나 보증하는 것이 아닙니다. 자세한 내용은 이용 약관을 참조하세요.
초대 전용 스크립트
이 스크립트는 작성자가 승인한 사용자만 접근할 수 있습니다. 사용하려면 요청 후 승인을 받아야 하며, 일반적으로 결제 후에 허가가 부여됩니다. 자세한 내용은 아래 작성자의 안내를 따르거나 HashedPlutus에게 직접 문의하세요.
트레이딩뷰는 스크립트의 작동 방식을 충분히 이해하고 작성자를 완전히 신뢰하지 않는 이상, 해당 스크립트에 비용을 지불하거나 사용하는 것을 권장하지 않습니다. 커뮤니티 스크립트에서 무료 오픈소스 대안을 찾아보실 수도 있습니다.
작성자 지시 사항
면책사항
해당 정보와 게시물은 금융, 투자, 트레이딩 또는 기타 유형의 조언이나 권장 사항으로 간주되지 않으며, 트레이딩뷰에서 제공하거나 보증하는 것이 아닙니다. 자세한 내용은 이용 약관을 참조하세요.