OPEN-SOURCE SCRIPT
V Pattern Trend
DESCRIPTION:
The V Pattern Trend Indicator is designed to identify and highlight V-shaped reversal patterns in price action. It detects both bullish and bearish V formations using a five-candle structure, helping traders recognize potential trend reversal points. The indicator filters out insignificant patterns by using customizable settings based on ATR, percentage, or points, ensuring that only meaningful V patterns are displayed.
CALCULATION METHOD
The user can choose how the minimum length of a V pattern is determined. The available options are:
ATR SETTINGS
PERCENTAGE THRESHOLD
- Sets a minimum percentage difference between the V high and V low for a pattern to be considered valid.
POINTS THRESHOLD
- Defines the minimum price movement (in points) required for a V pattern to be considered significant.

PATTERN VISUALIZATION
UNDERSTANDING V PATTERNS
A V pattern is a sharp reversal formation where price moves strongly in one direction and then rapidly reverses in the opposite direction, forming a "V" shape on the chart.
BULLISH V PATTERN
Pine Script®

BEARISH V PATTERN
Pine Script®

HOW THIS IS UNIQUE
HOW TRADERS CAN USE THIS INDICATOR
The V Pattern Trend Indicator is designed to identify and highlight V-shaped reversal patterns in price action. It detects both bullish and bearish V formations using a five-candle structure, helping traders recognize potential trend reversal points. The indicator filters out insignificant patterns by using customizable settings based on ATR, percentage, or points, ensuring that only meaningful V patterns are displayed.
CALCULATION METHOD
The user can choose how the minimum length of a V pattern is determined. The available options are:
- - ATR (Average True Range) – Filters V patterns based on ATR, making the detection adaptive to market volatility.
- - Percentage (%) – Considers V patterns where the absolute price difference between the V low and V high is greater than a user-defined percentage of the V high.
- - Points – Uses a fixed number of points to filter valid V patterns, making it useful for assets with consistent price ranges.
ATR SETTINGS
- - ATR Length – Defines the number of periods for ATR calculation.
- - ATR Multiplier – Determines the minimum V length as a multiple of ATR.
PERCENTAGE THRESHOLD
- Sets a minimum percentage difference between the V high and V low for a pattern to be considered valid.
POINTS THRESHOLD
- Defines the minimum price movement (in points) required for a V pattern to be considered significant.
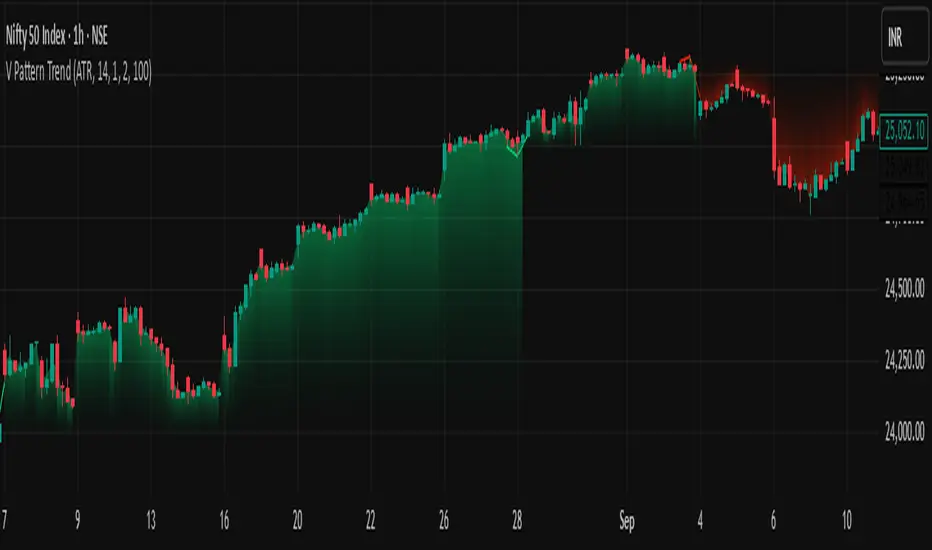
PATTERN VISUALIZATION
- - A bullish V pattern is plotted using two upward-sloping lines, with a filled green region to highlight the formation.
- - A bearish V pattern is plotted using two downward-sloping lines, with a filled red region to indicate the reversal.
- - The indicator dynamically updates and marks only the most recent valid patterns.
UNDERSTANDING V PATTERNS
A V pattern is a sharp reversal formation where price moves strongly in one direction and then rapidly reverses in the opposite direction, forming a "V" shape on the chart.
BULLISH V PATTERN
- - A bullish V pattern is formed when the price makes three consecutive lower lows, followed by two consecutive higher lows.
- - The pattern is confirmed when the highest high of the formation is greater than the previous highs within the structure.
- - This pattern suggests a potential trend reversal from bearish to bullish.
- - The lowest point of the pattern represents the V low, which acts as a support level.
bull_five_candle_v = low[4] > low[3] and low[3] > low[2] and low[1] > low[2] and low > low[1]
and high[4] > math.max(high[3], high[2], high[1]) and high > math.max(high[3], high[2], high[1])
BEARISH V PATTERN
- - A bearish V pattern is detected when the price makes three consecutive higher highs, followed by two consecutive lower highs.
- - The pattern is confirmed when the lowest low of the formation is lower than the previous lows within the structure.
- - This pattern signals a possible trend reversal from bullish to bearish.
- - The highest point of the pattern represents the V high, which acts as a resistance level.
bear_five_candle_v = high[4] < high[3] and high[3] < high[2] and high[1] < high[2] and high < high[1]
and low[4] < math.min(low[3], low[2], low[1]) and low < math.min(low[3], low[2], low[1])
HOW THIS IS UNIQUE
- - Advanced Filtering Mechanism – Unlike basic reversal indicators, this tool provides customizable filtering based on ATR, percentage, or points, ensuring that only significant V patterns are displayed.
- - Enhanced Visual Clarity – The indicator uses color-coded fills and structured plotting to make reversal patterns easy to recognize.
- - Works Across Market Conditions – Adaptable to different market environments, filtering out weak or insignificant price fluctuations.
- - Multi-Timeframe Usability – Can be applied across different timeframes and asset classes, making it useful for both intraday and swing trading.
HOW TRADERS CAN USE THIS INDICATOR
- - Identify potential trend reversals early based on structured price action.
- - Filter out weak or insignificant reversals to focus only on strong V formations.
- - Use the V pattern’s highs and lows as key support and resistance zones for trade entries and exits.
- - Combine with other indicators like moving averages, trendlines, or momentum oscillators for confirmation.
오픈 소스 스크립트
트레이딩뷰의 진정한 정신에 따라, 이 스크립트의 작성자는 이를 오픈소스로 공개하여 트레이더들이 기능을 검토하고 검증할 수 있도록 했습니다. 작성자에게 찬사를 보냅니다! 이 코드는 무료로 사용할 수 있지만, 코드를 재게시하는 경우 하우스 룰이 적용된다는 점을 기억하세요.
Shivam mandai
면책사항
해당 정보와 게시물은 금융, 투자, 트레이딩 또는 기타 유형의 조언이나 권장 사항으로 간주되지 않으며, 트레이딩뷰에서 제공하거나 보증하는 것이 아닙니다. 자세한 내용은 이용 약관을 참조하세요.
오픈 소스 스크립트
트레이딩뷰의 진정한 정신에 따라, 이 스크립트의 작성자는 이를 오픈소스로 공개하여 트레이더들이 기능을 검토하고 검증할 수 있도록 했습니다. 작성자에게 찬사를 보냅니다! 이 코드는 무료로 사용할 수 있지만, 코드를 재게시하는 경우 하우스 룰이 적용된다는 점을 기억하세요.
Shivam mandai
면책사항
해당 정보와 게시물은 금융, 투자, 트레이딩 또는 기타 유형의 조언이나 권장 사항으로 간주되지 않으며, 트레이딩뷰에서 제공하거나 보증하는 것이 아닙니다. 자세한 내용은 이용 약관을 참조하세요.