PROTECTED SOURCE SCRIPT
3 Heiken Ashi
# Heiken Ashi Overlay Indicator
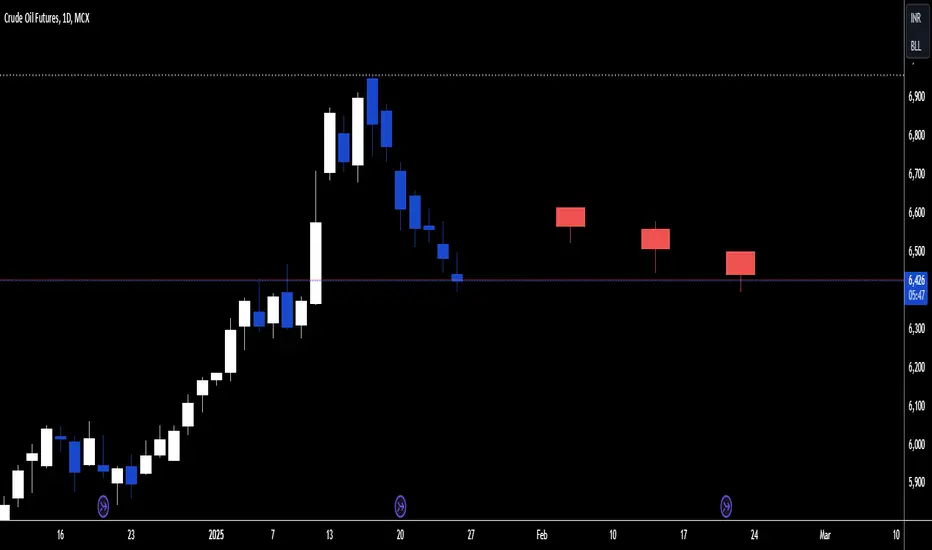
This custom indicator overlays the last three Heiken Ashi candles on your regular candlestick chart, providing traders with immediate trend direction insights without switching between chart types.
## Key Features
- **Real-time Overlay**: Displays three most recent Heiken Ashi candles on the right side of your chart
- **Color Coding**: Green candles indicate upward momentum, red candles show downward momentum
- **Timeframe Adaptive**: Maintains consistent display across all timeframes
- **Clean Visualization**: Clear separation between regular candlesticks and Heiken Ashi overlay
## Trading Applications
**Trend Confirmation**
- Green Heiken Ashi candles suggest strengthening bullish momentum
- Red Heiken Ashi candles indicate developing bearish pressure
- The sequence of colors helps identify potential trend reversals
**Decision Making Benefits**
- Quick trend assessment without chart switching
- Enhanced signal confirmation
- Reduced noise in trend identification
- Improved entry and exit timing
## Technical Details
The indicator uses standard Heiken Ashi calculations:
- HA Close = (Open + High + Low + Close)/4
- HA Open = Previous HA (Open + Close)/2
- HA High = Maximum(High, HA Open, HA Close)
- HA Low = Minimum(Low, HA Open, HA Close)
## Usage Tips
1. Use alongside your regular technical analysis
2. Watch for color changes as early trend reversal signals
3. Consider the size of Heiken Ashi candles for momentum strength
4. Compare with price action on the main chart for confirmation
This overlay combines the smoothing benefits of Heiken Ashi with the precision of regular candlesticks, offering traders a powerful tool for trend analysis and decision-making.
보호된 스크립트입니다
이 스크립트는 비공개 소스로 게시됩니다. 하지만 이를 자유롭게 제한 없이 사용할 수 있습니다 – 자세한 내용은 여기에서 확인하세요.
면책사항
해당 정보와 게시물은 금융, 투자, 트레이딩 또는 기타 유형의 조언이나 권장 사항으로 간주되지 않으며, 트레이딩뷰에서 제공하거나 보증하는 것이 아닙니다. 자세한 내용은 이용 약관을 참조하세요.
보호된 스크립트입니다
이 스크립트는 비공개 소스로 게시됩니다. 하지만 이를 자유롭게 제한 없이 사용할 수 있습니다 – 자세한 내용은 여기에서 확인하세요.
면책사항
해당 정보와 게시물은 금융, 투자, 트레이딩 또는 기타 유형의 조언이나 권장 사항으로 간주되지 않으며, 트레이딩뷰에서 제공하거나 보증하는 것이 아닙니다. 자세한 내용은 이용 약관을 참조하세요.