OPEN-SOURCE SCRIPT
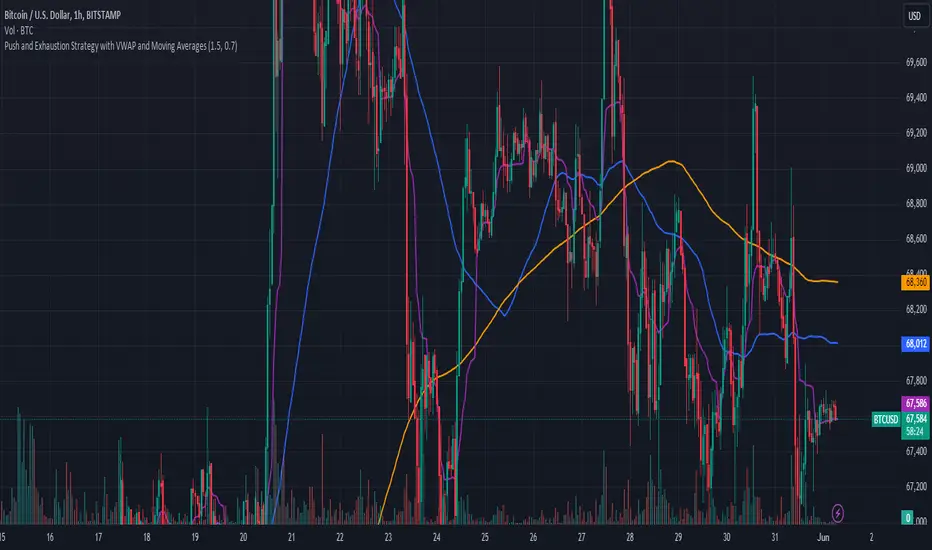
Push and Exhaustion Strategy with VWAP and Moving Averages
Overview:
The Push and Exhaustion Strategy Indicator is a custom technical analysis tool designed to help traders identify potential market turning points by highlighting significant price movements (pushes) and subsequent periods of reduced momentum (exhaustion). This indicator also incorporates key moving averages (50-period and 200-period) and the Volume Weighted Average Price (VWAP) to provide additional context for trading decisions.
Components:
Push and Exhaustion Thresholds:
Push Threshold: Set at 1.5 by default. This means the price must increase by 50% or more compared to the previous close to signal a push.
Exhaustion Threshold: Set at 0.7 by default. This means the price must decrease by 30% or more compared to the previous close to signal exhaustion.
VWAP (Volume Weighted Average Price):
VWAP is plotted on the chart to provide an average price weighted by volume, giving insight into the true average price paid for an asset.
Moving Averages:
50-period Moving Average (MA): Plotted in blue, it helps identify the short-to-mid-term trend direction.
200-period Moving Average (MA): Plotted in orange, it helps identify the long-term trend direction.
How It Works:
Push Condition:
A push signal is generated when the current closing price is at least 1.5 times the previous closing price (pushThreshold).
Additionally, the closing price must be above the VWAP, indicating strong upward momentum.
When these conditions are met, a green triangle is plotted above the price bar.
Exhaustion Condition:
An exhaustion signal is generated when the current closing price is at most 0.7 times the previous closing price (exhaustionThreshold).
Additionally, the closing price must be below the VWAP, indicating weakened momentum and potential reversal.
When these conditions are met, a red triangle is plotted below the price bar.
Visualization:
The indicator plots green triangles above bars to indicate a push signal and red triangles below bars to indicate an exhaustion signal.
It also plots the 50-period and 200-period moving averages as blue and orange lines, respectively.
The VWAP is plotted as a purple line, showing the average price considering the trading volume.
Alerts:
The indicator includes optional alerts that notify the trader when a push or exhaustion signal is detected.
Usage:
Push Signals: Traders might use push signals to enter trades in the direction of strong momentum, typically buying in an uptrend.
Exhaustion Signals: Traders might use exhaustion signals to anticipate potential reversals, considering exiting positions or entering counter-trend trades.
Moving Averages: The 50-period and 200-period moving averages help provide context to the overall trend, aiding in decision-making.
VWAP: Being above or below the VWAP helps validate the strength of the price movement.
This indicator provides a comprehensive view of market momentum, aiding traders in making informed decisions by highlighting significant price moves and potential reversals within the context of prevailing trends.
오픈 소스 스크립트
트레이딩뷰의 진정한 정신에 따라, 이 스크립트의 작성자는 이를 오픈소스로 공개하여 트레이더들이 기능을 검토하고 검증할 수 있도록 했습니다. 작성자에게 찬사를 보냅니다! 이 코드는 무료로 사용할 수 있지만, 코드를 재게시하는 경우 하우스 룰이 적용된다는 점을 기억하세요.
면책사항
해당 정보와 게시물은 금융, 투자, 트레이딩 또는 기타 유형의 조언이나 권장 사항으로 간주되지 않으며, 트레이딩뷰에서 제공하거나 보증하는 것이 아닙니다. 자세한 내용은 이용 약관을 참조하세요.
오픈 소스 스크립트
트레이딩뷰의 진정한 정신에 따라, 이 스크립트의 작성자는 이를 오픈소스로 공개하여 트레이더들이 기능을 검토하고 검증할 수 있도록 했습니다. 작성자에게 찬사를 보냅니다! 이 코드는 무료로 사용할 수 있지만, 코드를 재게시하는 경우 하우스 룰이 적용된다는 점을 기억하세요.
면책사항
해당 정보와 게시물은 금융, 투자, 트레이딩 또는 기타 유형의 조언이나 권장 사항으로 간주되지 않으며, 트레이딩뷰에서 제공하거나 보증하는 것이 아닙니다. 자세한 내용은 이용 약관을 참조하세요.