OPEN-SOURCE SCRIPT
업데이트됨 Weekly OHLM [CrossTrade]
The "Weekly OHLM" is a versatile utility indicator designed for traders who focus on weekly price movements. This indicator offers a comprehensive view of an asset's weekly price range and dynamic signaling features. Here's a summary of its key functionalities and how it works:
Weekly Price Levels: The indicator plots three critical levels based on weekly price data: the weekly high, weekly low, and weekly open. These levels are recalculated every week, providing a clear picture of the price range and the opening price for the week.
Midpoint Calculation: A crucial feature of this indicator is the calculation of the midpoint of the week's price range. This midpoint is derived by averaging the weekly high and weekly low, offering a reference point for the week's price equilibrium.
Dynamic Updating: As the week progresses, the indicator dynamically updates the weekly high and low if newer high or low prices are observed. This feature ensures that the plotted levels accurately reflect the current week's price movements.
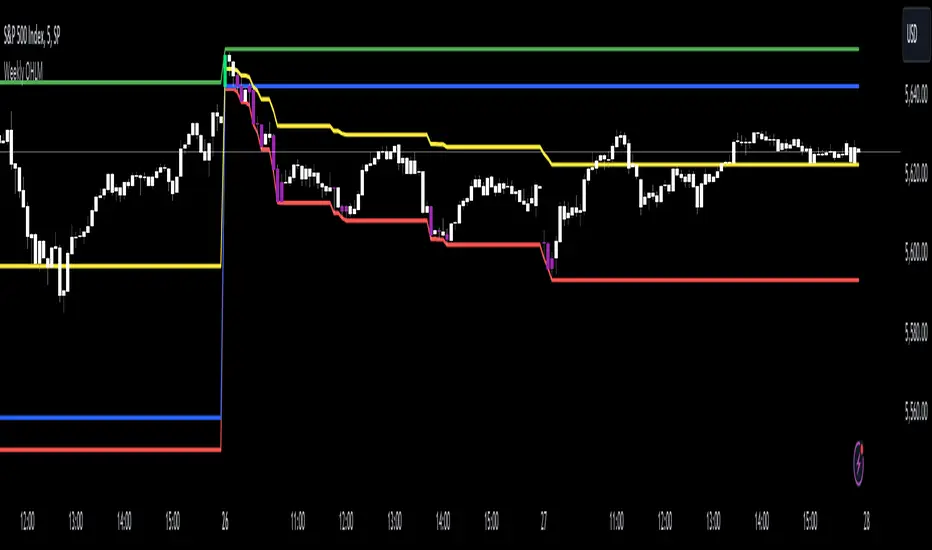
Visual Highlights: The indicator uses color-coded plots to enhance visual clarity. The weekly high is marked in green, the weekly low in red, and the weekly open in blue. The midpoint is plotted in yellow, making it easily distinguishable.
Bar Coloring for New Highs and Lows: Bars that touch or surpass the weekly high are colored lime, and those that touch or drop below the weekly low are colored purple. This color-coding provides immediate visual cues about price touching these significant levels.
Alert System
The indicator includes a sophisticated alert system that notifies traders of specific events:
Crossing Over Midpoint: An alert is triggered when the price crosses over the midpoint, suggesting a potential upward movement.
Crossing Under Midpoint: An alert is activated when the price crosses under the midpoint, indicating a potential downward trend.
Weekly High and Low Touch: Alerts can also be set for when the price touches or exceeds the weekly high or low, signaling significant price movements.
This indicator is particularly useful for traders who base their strategies on weekly timeframes or need to understand weekly price dynamics in relation to intraday trading. By offering a clear view of important price levels and dynamic alerts, it aids in making informed trading decisions based on significant weekly price movements.
Weekly Price Levels: The indicator plots three critical levels based on weekly price data: the weekly high, weekly low, and weekly open. These levels are recalculated every week, providing a clear picture of the price range and the opening price for the week.
Midpoint Calculation: A crucial feature of this indicator is the calculation of the midpoint of the week's price range. This midpoint is derived by averaging the weekly high and weekly low, offering a reference point for the week's price equilibrium.
Dynamic Updating: As the week progresses, the indicator dynamically updates the weekly high and low if newer high or low prices are observed. This feature ensures that the plotted levels accurately reflect the current week's price movements.
Visual Highlights: The indicator uses color-coded plots to enhance visual clarity. The weekly high is marked in green, the weekly low in red, and the weekly open in blue. The midpoint is plotted in yellow, making it easily distinguishable.
Bar Coloring for New Highs and Lows: Bars that touch or surpass the weekly high are colored lime, and those that touch or drop below the weekly low are colored purple. This color-coding provides immediate visual cues about price touching these significant levels.
Alert System
The indicator includes a sophisticated alert system that notifies traders of specific events:
Crossing Over Midpoint: An alert is triggered when the price crosses over the midpoint, suggesting a potential upward movement.
Crossing Under Midpoint: An alert is activated when the price crosses under the midpoint, indicating a potential downward trend.
Weekly High and Low Touch: Alerts can also be set for when the price touches or exceeds the weekly high or low, signaling significant price movements.
This indicator is particularly useful for traders who base their strategies on weekly timeframes or need to understand weekly price dynamics in relation to intraday trading. By offering a clear view of important price levels and dynamic alerts, it aids in making informed trading decisions based on significant weekly price movements.
릴리즈 노트
Making this indicator open source!릴리즈 노트
Replaced the flawed week detection logic with timeframe.change('1W') to properly detect. weekly transitions according to the chart's timezone and market sessions오픈 소스 스크립트
트레이딩뷰의 진정한 정신에 따라, 이 스크립트의 작성자는 이를 오픈소스로 공개하여 트레이더들이 기능을 검토하고 검증할 수 있도록 했습니다. 작성자에게 찬사를 보냅니다! 이 코드는 무료로 사용할 수 있지만, 코드를 재게시하는 경우 하우스 룰이 적용된다는 점을 기억하세요.
면책사항
해당 정보와 게시물은 금융, 투자, 트레이딩 또는 기타 유형의 조언이나 권장 사항으로 간주되지 않으며, 트레이딩뷰에서 제공하거나 보증하는 것이 아닙니다. 자세한 내용은 이용 약관을 참조하세요.
오픈 소스 스크립트
트레이딩뷰의 진정한 정신에 따라, 이 스크립트의 작성자는 이를 오픈소스로 공개하여 트레이더들이 기능을 검토하고 검증할 수 있도록 했습니다. 작성자에게 찬사를 보냅니다! 이 코드는 무료로 사용할 수 있지만, 코드를 재게시하는 경우 하우스 룰이 적용된다는 점을 기억하세요.
면책사항
해당 정보와 게시물은 금융, 투자, 트레이딩 또는 기타 유형의 조언이나 권장 사항으로 간주되지 않으며, 트레이딩뷰에서 제공하거나 보증하는 것이 아닙니다. 자세한 내용은 이용 약관을 참조하세요.