OPEN-SOURCE SCRIPT
ORB Screener with Trailing SL
This is an extension to our already published script ORB with ATR Trailing SL indicator
Many people requested to add screener to the existing indicator but since it's slowing down the performance heavily, we decided to add this as a separate screener.
Note: This screener does NOT plot the chart and so you want to have both plotting and screener, use both scripts together.
Overview:
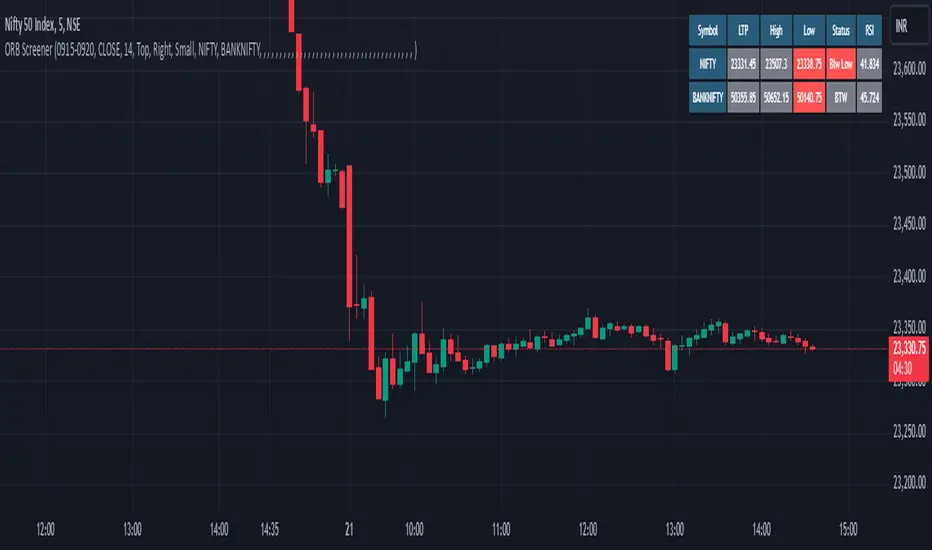
The ORB Screener is a TradingView indicator designed to assist traders in identifying breakout opportunities based on the Opening Range Breakout (ORB) strategy. It features multi-symbol screening, customizable session timeframes, and a detailed table for quick visual reference and stock scanning.
The ORB Screener utilizes the ORB strategy to calculate breakout levels for multiple symbols. It identifies the high and low during a specified session (e.g., first 5 minutes after market open) and provides insights on whether the price is above the high (bullish), below the low (bearish), or between the range (neutral).
Additionally, the script calculates and displays the RSI values for each symbol, aiding traders in assessing momentum alongside breakout status.
Note: One can add up to 40 symbols for screening the stocks.
Key Features and Inputs:
ORB Session Time: Define a specific timeframe (e.g., "0915-0920") during which the ORB high and low are calculated. This serves as the foundation for identifying breakouts.
Multi-Symbol Screening: Screen up to 40 symbols at once, enabling you to monitor multiple opportunities without switching charts.
Breakout Validation:
Select from two methods for confirming a breakout: Close (based on closing prices) or Touch (based on intraday highs/lows).
Breakout Status Indicators:
Above High: Indicates a current bullish breakout when the price exceeds the ORB high.
Below Low: Indicates a current bearish breakout when the price falls below the ORB low.
Between Range: Indicates no breakout (price remains within the range).
RSI Integration: Calculates the RSI for each symbol to help traders evaluate momentum alongside breakout signals.
Customizable Table Display:
Position: Place the data table at the top, middle, or bottom of the chart and align it left, center, or right.
Size: Choose from multiple table size options for optimal visibility (Auto, Huge, Large, Normal, Small, Tiny).
Visual Feedback:
Green Background: Indicates a breakout happened at least once above the ORB high.
Red Background: Indicates a breakout happened at least once below the ORB low.
Gray Background: Indicates price is within the ORB range.
Many people requested to add screener to the existing indicator but since it's slowing down the performance heavily, we decided to add this as a separate screener.
Note: This screener does NOT plot the chart and so you want to have both plotting and screener, use both scripts together.
Overview:
The ORB Screener is a TradingView indicator designed to assist traders in identifying breakout opportunities based on the Opening Range Breakout (ORB) strategy. It features multi-symbol screening, customizable session timeframes, and a detailed table for quick visual reference and stock scanning.
The ORB Screener utilizes the ORB strategy to calculate breakout levels for multiple symbols. It identifies the high and low during a specified session (e.g., first 5 minutes after market open) and provides insights on whether the price is above the high (bullish), below the low (bearish), or between the range (neutral).
Additionally, the script calculates and displays the RSI values for each symbol, aiding traders in assessing momentum alongside breakout status.
Note: One can add up to 40 symbols for screening the stocks.
Key Features and Inputs:
ORB Session Time: Define a specific timeframe (e.g., "0915-0920") during which the ORB high and low are calculated. This serves as the foundation for identifying breakouts.
Multi-Symbol Screening: Screen up to 40 symbols at once, enabling you to monitor multiple opportunities without switching charts.
Breakout Validation:
Select from two methods for confirming a breakout: Close (based on closing prices) or Touch (based on intraday highs/lows).
Breakout Status Indicators:
Above High: Indicates a current bullish breakout when the price exceeds the ORB high.
Below Low: Indicates a current bearish breakout when the price falls below the ORB low.
Between Range: Indicates no breakout (price remains within the range).
RSI Integration: Calculates the RSI for each symbol to help traders evaluate momentum alongside breakout signals.
Customizable Table Display:
Position: Place the data table at the top, middle, or bottom of the chart and align it left, center, or right.
Size: Choose from multiple table size options for optimal visibility (Auto, Huge, Large, Normal, Small, Tiny).
Visual Feedback:
Green Background: Indicates a breakout happened at least once above the ORB high.
Red Background: Indicates a breakout happened at least once below the ORB low.
Gray Background: Indicates price is within the ORB range.
오픈 소스 스크립트
트레이딩뷰의 진정한 정신에 따라, 이 스크립트의 작성자는 이를 오픈소스로 공개하여 트레이더들이 기능을 검토하고 검증할 수 있도록 했습니다. 작성자에게 찬사를 보냅니다! 이 코드는 무료로 사용할 수 있지만, 코드를 재게시하는 경우 하우스 룰이 적용된다는 점을 기억하세요.
면책사항
해당 정보와 게시물은 금융, 투자, 트레이딩 또는 기타 유형의 조언이나 권장 사항으로 간주되지 않으며, 트레이딩뷰에서 제공하거나 보증하는 것이 아닙니다. 자세한 내용은 이용 약관을 참조하세요.
오픈 소스 스크립트
트레이딩뷰의 진정한 정신에 따라, 이 스크립트의 작성자는 이를 오픈소스로 공개하여 트레이더들이 기능을 검토하고 검증할 수 있도록 했습니다. 작성자에게 찬사를 보냅니다! 이 코드는 무료로 사용할 수 있지만, 코드를 재게시하는 경우 하우스 룰이 적용된다는 점을 기억하세요.
면책사항
해당 정보와 게시물은 금융, 투자, 트레이딩 또는 기타 유형의 조언이나 권장 사항으로 간주되지 않으며, 트레이딩뷰에서 제공하거나 보증하는 것이 아닙니다. 자세한 내용은 이용 약관을 참조하세요.