OPEN-SOURCE SCRIPT
업데이트됨 TICK Charting & Divergences
Overview
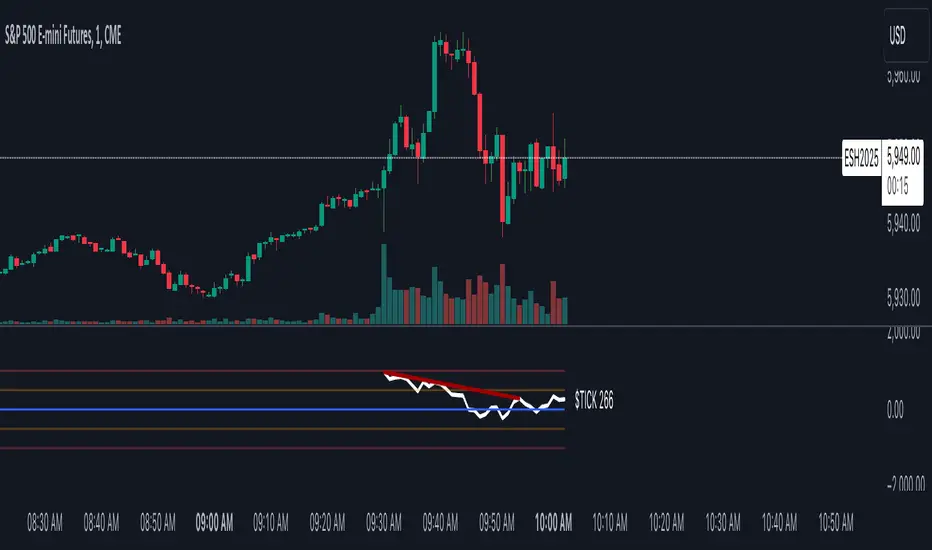
The TICK index measures the number of NYSE stocks making an uptick versus a downtick. This indicator identifies divergences between price action and TICK readings, potentially signaling trend reversals.
Key Features
TICK Internals Interpretation
Best Practices
Settings Optimization
Warning Signs
Remember: TICK divergences are not guaranteed signals. Always use proper risk management and combine with other technical analysis tools.
The TICK index measures the number of NYSE stocks making an uptick versus a downtick. This indicator identifies divergences between price action and TICK readings, potentially signaling trend reversals.
Key Features
- Real-time TICK monitoring during market hours (9:30 AM - 4:00 PM ET)
- Customizable smoothing factor for TICK values
- Regular and hidden divergences detection
- Reference lines at ±500 and ±1000 levels
- Current TICK value display
TICK Internals Interpretation
- Above +1000: Strong buying pressure, potential exhaustion
- Above +500: Moderate buying pressure
- Below -500: Moderate selling pressure
- Below -1000: Strong selling pressure, potential exhaustion
Best Practices
- Use in conjunction with support/resistance levels, market trend direction, and time of day.
- Higher probability setups with multiple timeframe confirmation, divergence at key price levels, and extreme TICK readings (±1000).
Settings Optimization
- Smoothing Factor: 1-3 (lower for faster signals)
- Pivot Lookback: 5-10 bars (adjust based on timeframe)
- Range: 5-60 bars (wider for longer-term signals)
Warning Signs
- Multiple failed divergences
- Choppy price action
- Low volume periods
- Major news events pending
Remember: TICK divergences are not guaranteed signals. Always use proper risk management and combine with other technical analysis tools.
릴리즈 노트
Updated with better chart image.릴리즈 노트
Updated naming in indicator pane.오픈 소스 스크립트
트레이딩뷰의 진정한 정신에 따라, 이 스크립트의 작성자는 이를 오픈소스로 공개하여 트레이더들이 기능을 검토하고 검증할 수 있도록 했습니다. 작성자에게 찬사를 보냅니다! 이 코드는 무료로 사용할 수 있지만, 코드를 재게시하는 경우 하우스 룰이 적용된다는 점을 기억하세요.
면책사항
해당 정보와 게시물은 금융, 투자, 트레이딩 또는 기타 유형의 조언이나 권장 사항으로 간주되지 않으며, 트레이딩뷰에서 제공하거나 보증하는 것이 아닙니다. 자세한 내용은 이용 약관을 참조하세요.
오픈 소스 스크립트
트레이딩뷰의 진정한 정신에 따라, 이 스크립트의 작성자는 이를 오픈소스로 공개하여 트레이더들이 기능을 검토하고 검증할 수 있도록 했습니다. 작성자에게 찬사를 보냅니다! 이 코드는 무료로 사용할 수 있지만, 코드를 재게시하는 경우 하우스 룰이 적용된다는 점을 기억하세요.
면책사항
해당 정보와 게시물은 금융, 투자, 트레이딩 또는 기타 유형의 조언이나 권장 사항으로 간주되지 않으며, 트레이딩뷰에서 제공하거나 보증하는 것이 아닙니다. 자세한 내용은 이용 약관을 참조하세요.