OPEN-SOURCE SCRIPT
업데이트됨 RMI
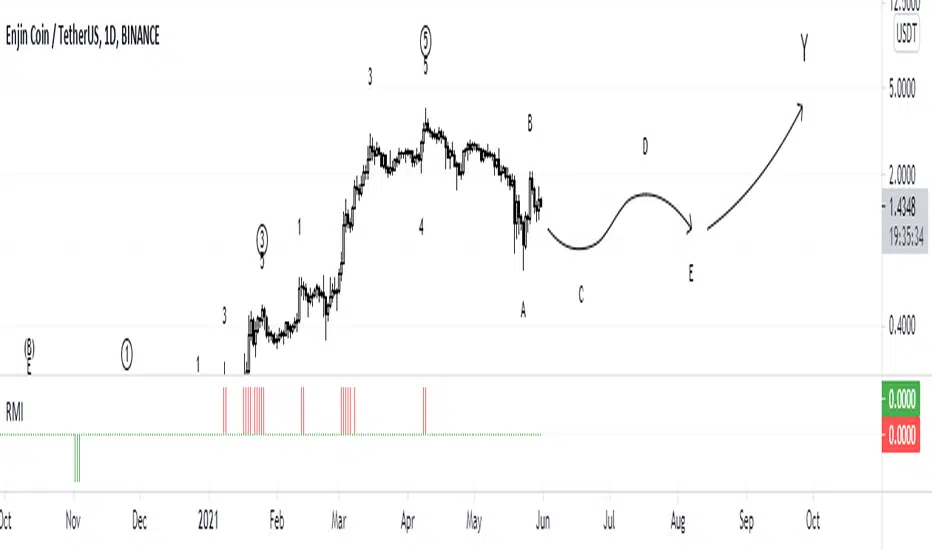
RMI is a combination of RSI and MFI oscillators which considers money flow and strength of supply or demand together.
It estimates that the money of which side is being ran out.
So the power of trends can be predictable approximately.
Where the green columns appear, it means demand is very high and it can fall because buyers may withdraw and sell their assets.
And when red columns appear, it means supply is very high and sellers or new buyers may enter into new deals which may increase the price of a asset.
I would be glad if I hear your feedbacks.
릴리즈 노트
RSI and MFI default values are corrected.There was an extra space bar that is deleted.
릴리즈 노트
It determines if MFI is upper than RSI in overbought and lower than it in oversold zones. It causes more accuracy to specify whether buyers or sellers will be coming or not.오픈 소스 스크립트
트레이딩뷰의 진정한 정신에 따라, 이 스크립트의 작성자는 이를 오픈소스로 공개하여 트레이더들이 기능을 검토하고 검증할 수 있도록 했습니다. 작성자에게 찬사를 보냅니다! 이 코드는 무료로 사용할 수 있지만, 코드를 재게시하는 경우 하우스 룰이 적용된다는 점을 기억하세요.
면책사항
해당 정보와 게시물은 금융, 투자, 트레이딩 또는 기타 유형의 조언이나 권장 사항으로 간주되지 않으며, 트레이딩뷰에서 제공하거나 보증하는 것이 아닙니다. 자세한 내용은 이용 약관을 참조하세요.
오픈 소스 스크립트
트레이딩뷰의 진정한 정신에 따라, 이 스크립트의 작성자는 이를 오픈소스로 공개하여 트레이더들이 기능을 검토하고 검증할 수 있도록 했습니다. 작성자에게 찬사를 보냅니다! 이 코드는 무료로 사용할 수 있지만, 코드를 재게시하는 경우 하우스 룰이 적용된다는 점을 기억하세요.
면책사항
해당 정보와 게시물은 금융, 투자, 트레이딩 또는 기타 유형의 조언이나 권장 사항으로 간주되지 않으며, 트레이딩뷰에서 제공하거나 보증하는 것이 아닙니다. 자세한 내용은 이용 약관을 참조하세요.