OPEN-SOURCE SCRIPT
Line Colorizer - Durbtrade
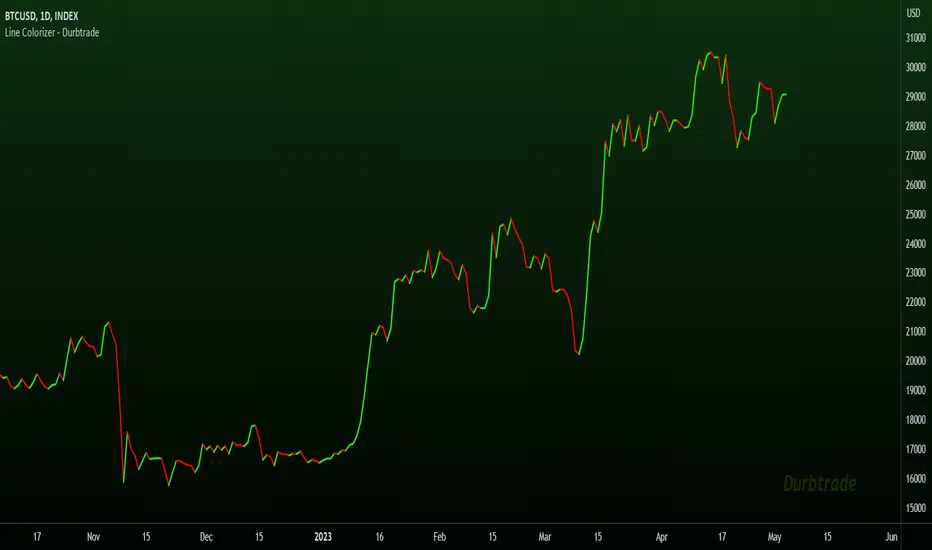
The Line Colorizer is a simple indicator that can plot up/down-colorized lines for up to 10 unique individual sources!
Plot up/down colors are based on whether the current value is above or below the previous value.
Also included is a separate color for when the current value is equal to the previous value.
All colors can be modified, along with the plot styles.
--------------------------------------------

--------------------------------------------
Here is the Inputs tab of the Settings menu :

As you can see, you can plot a colorized line of up to 10 individual sources!
Checking the checkbox turns on that particular colorized plot,
and clicking on the drop down menu allows you select the source for that plot.
The plot styles, up/equal/down colors, and opacities
are customizable under the Style tab within the Settings menu :

Overall, it is pretty easy to use.
--------------------------------------------
Let's look at some examples of the Line Colorizer being used...
Colorize a basic Bollinger Bands indicator :

Want to colorize 3 EMA's? Go for it :

Spice up the standard MACD salad :

Customize the colors of your RSI's :

Try using the Line Colorizer on all of your favorite indicators.
--------------------------------------------
Script Stats :
Pinescript Version : 5
Code Length : 44 Lines
Max Unique Input Sources : 10
Max Visible Plots : 10
Total Colors/Opacities : 30
--------------------------------------------
Tips :
Typically you will want this indicator to be on a layer above (in front of) the source plot layer.
Stay mindful of line thicknesses,
and whether the original source plot is still visible or not.
The final output of the colorized plots are drawn in numerical order,
so, Colorized Source #1 is drawn first, and will appear below Colorized Source #2 on the chart...
and so on, with Colorized Source #10 being drawn last, at the very top.
Final Thoughts :
I like having this indicator.
The idea and script is simple, and the indicator is practical.
It's one method of easily separating some of the aspects of color from your favorite indicators and scripts,
and then customizing those aspects to your liking.
Especially practical for those who do not want to learn about writing their own scripts.
I think that this indicator can be a useful tool in the shed,
used for customizing the visuals of multiple unique sources
that are all on the same price/value scale.
It can help increase chart clarity and/or detail...
whether using it on top of a main chart that is simple,
or on top of a standalone indicator that is crowded with oscillating information.
I hope that you enjoy it and find it useful!
- Please feel free to comment your thoughts, critiques, or suggestions. They are all very helpful!
- Also, please feel free to comment any positive feedback, or awesome screencaps/ideas of the indicator in action!
- Check out my other Pinescript indicators if you like this one... they work well together.
- May your trades be successful!
--------------------------------------------
// Durbtrade
Plot up/down colors are based on whether the current value is above or below the previous value.
Also included is a separate color for when the current value is equal to the previous value.
All colors can be modified, along with the plot styles.
--------------------------------------------
--------------------------------------------
Here is the Inputs tab of the Settings menu :
As you can see, you can plot a colorized line of up to 10 individual sources!
Checking the checkbox turns on that particular colorized plot,
and clicking on the drop down menu allows you select the source for that plot.
The plot styles, up/equal/down colors, and opacities
are customizable under the Style tab within the Settings menu :
Overall, it is pretty easy to use.
--------------------------------------------
Let's look at some examples of the Line Colorizer being used...
Colorize a basic Bollinger Bands indicator :
Want to colorize 3 EMA's? Go for it :
Spice up the standard MACD salad :
Customize the colors of your RSI's :
Try using the Line Colorizer on all of your favorite indicators.
--------------------------------------------
Script Stats :
Pinescript Version : 5
Code Length : 44 Lines
Max Unique Input Sources : 10
Max Visible Plots : 10
Total Colors/Opacities : 30
--------------------------------------------
Tips :
Typically you will want this indicator to be on a layer above (in front of) the source plot layer.
Stay mindful of line thicknesses,
and whether the original source plot is still visible or not.
The final output of the colorized plots are drawn in numerical order,
so, Colorized Source #1 is drawn first, and will appear below Colorized Source #2 on the chart...
and so on, with Colorized Source #10 being drawn last, at the very top.
Final Thoughts :
I like having this indicator.
The idea and script is simple, and the indicator is practical.
It's one method of easily separating some of the aspects of color from your favorite indicators and scripts,
and then customizing those aspects to your liking.
Especially practical for those who do not want to learn about writing their own scripts.
I think that this indicator can be a useful tool in the shed,
used for customizing the visuals of multiple unique sources
that are all on the same price/value scale.
It can help increase chart clarity and/or detail...
whether using it on top of a main chart that is simple,
or on top of a standalone indicator that is crowded with oscillating information.
I hope that you enjoy it and find it useful!
- Please feel free to comment your thoughts, critiques, or suggestions. They are all very helpful!
- Also, please feel free to comment any positive feedback, or awesome screencaps/ideas of the indicator in action!
- Check out my other Pinescript indicators if you like this one... they work well together.
- May your trades be successful!
--------------------------------------------
// Durbtrade
오픈 소스 스크립트
트레이딩뷰의 진정한 정신에 따라, 이 스크립트의 작성자는 이를 오픈소스로 공개하여 트레이더들이 기능을 검토하고 검증할 수 있도록 했습니다. 작성자에게 찬사를 보냅니다! 이 코드는 무료로 사용할 수 있지만, 코드를 재게시하는 경우 하우스 룰이 적용된다는 점을 기억하세요.
면책사항
해당 정보와 게시물은 금융, 투자, 트레이딩 또는 기타 유형의 조언이나 권장 사항으로 간주되지 않으며, 트레이딩뷰에서 제공하거나 보증하는 것이 아닙니다. 자세한 내용은 이용 약관을 참조하세요.
오픈 소스 스크립트
트레이딩뷰의 진정한 정신에 따라, 이 스크립트의 작성자는 이를 오픈소스로 공개하여 트레이더들이 기능을 검토하고 검증할 수 있도록 했습니다. 작성자에게 찬사를 보냅니다! 이 코드는 무료로 사용할 수 있지만, 코드를 재게시하는 경우 하우스 룰이 적용된다는 점을 기억하세요.
면책사항
해당 정보와 게시물은 금융, 투자, 트레이딩 또는 기타 유형의 조언이나 권장 사항으로 간주되지 않으며, 트레이딩뷰에서 제공하거나 보증하는 것이 아닙니다. 자세한 내용은 이용 약관을 참조하세요.