PROTECTED SOURCE SCRIPT
업데이트됨 Net New Highs Crossover
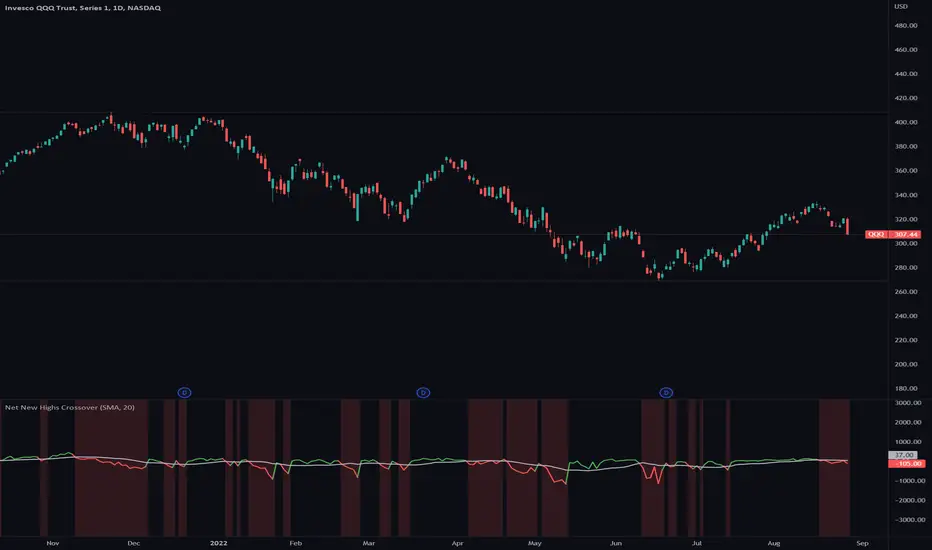
A lot of traders have a hard time to get in and out of the market at the right time.
Net New Highs of stocks can guide you to increase or decrease your exposure based on the current market health.
They are calculated by subtracting the new highs of the new lows, based on all stocks of the NYSE, NASDAQ and AMEX.
+ A positive value shows that the market is doing good, since more stocks are making new highs compared to new lows.
- A negative value shows that the market is doing bad, since more stocks are making new lows compared to new highs.
Combined with a moving average you can see crossovers that can warn you early when there is a change in the current market health.
Features
■ You can select different Net New High indices or combine them (NYSE, NASDAQ and AMEX)
■ You can specify a moving average line ( SMA / EMA and length)
■ Use single color or two colors for the moving average line to better spot the crossovers
Hints
*New highs and new lows index values currently only get updated at the end of the day
*Only works on daily timeframe
릴리즈 노트
Add support for weekly and monthly timeframes릴리즈 노트
Added more options to customize the styling보호된 스크립트입니다
이 스크립트는 비공개 소스로 게시됩니다. 하지만 이를 자유롭게 제한 없이 사용할 수 있습니다 – 자세한 내용은 여기에서 확인하세요.
면책사항
해당 정보와 게시물은 금융, 투자, 트레이딩 또는 기타 유형의 조언이나 권장 사항으로 간주되지 않으며, 트레이딩뷰에서 제공하거나 보증하는 것이 아닙니다. 자세한 내용은 이용 약관을 참조하세요.
면책사항
해당 정보와 게시물은 금융, 투자, 트레이딩 또는 기타 유형의 조언이나 권장 사항으로 간주되지 않으며, 트레이딩뷰에서 제공하거나 보증하는 것이 아닙니다. 자세한 내용은 이용 약관을 참조하세요.