PROTECTED SOURCE SCRIPT
VolCandle_Start_End Bars
The “VolCandle_Start_End Bars” Pine Script is a custom TradingView indicator designed to calculate and display volume-based candle statistics between two user-defined time points. It visually summarizes trading activity across a specific date range by comparing up-candle and down-candle volumes.
Functionality
The script allows users to select a start and end bar (dates) using the input fields “Select starting Bar” and “Select ending Bar.” It then examines all candles within this range to calculate:
Total volume for up candles (candles where the close is higher than the previous candle).
Total volume for down candles (candles where the close is lower than the previous candle).
Difference and ratio between up and down volumes.
Count of up and down candles within the period.
Calculation Logic
A loop checks each bar's closing price and compares it with the previous one.
For every matching bar within the chosen time range:
If the close increases → its volume is added to up volume.
If the close decreases → its volume is added to down volume.
The process continues for up to 1000 historical bars, counting each bar type and accumulating total volumes.
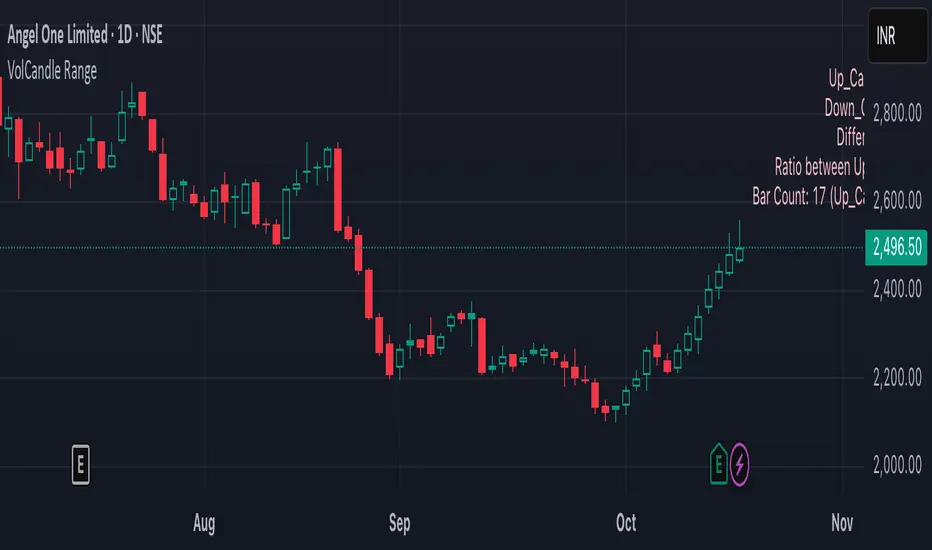
Display and Labeling
The script calculates an appropriate label position using recent highs and lows, then dynamically creates a label on the chart showing:
Up_Candles volume
Down_Candles volume
Volume difference and ratio
Total bar count with up/down candle counts
The text is displayed in a soft pink tone using the label.new() function for visual clarity.
Utility
This indicator helps traders easily analyze buying vs. selling volume pressure across custom time intervals. It is particularly useful for comparing sentiment in specific trading phases (for example, before and after a consolidation or breakout).
All computations are done locally on the chart — the indicator does not place trades or alter candles.
In short, this script provides a compact visual and statistical summary of market volume distribution between rising and falling candles in a chosen date window, offering insight into the dominant market force during that time range.
Functionality
The script allows users to select a start and end bar (dates) using the input fields “Select starting Bar” and “Select ending Bar.” It then examines all candles within this range to calculate:
Total volume for up candles (candles where the close is higher than the previous candle).
Total volume for down candles (candles where the close is lower than the previous candle).
Difference and ratio between up and down volumes.
Count of up and down candles within the period.
Calculation Logic
A loop checks each bar's closing price and compares it with the previous one.
For every matching bar within the chosen time range:
If the close increases → its volume is added to up volume.
If the close decreases → its volume is added to down volume.
The process continues for up to 1000 historical bars, counting each bar type and accumulating total volumes.
Display and Labeling
The script calculates an appropriate label position using recent highs and lows, then dynamically creates a label on the chart showing:
Up_Candles volume
Down_Candles volume
Volume difference and ratio
Total bar count with up/down candle counts
The text is displayed in a soft pink tone using the label.new() function for visual clarity.
Utility
This indicator helps traders easily analyze buying vs. selling volume pressure across custom time intervals. It is particularly useful for comparing sentiment in specific trading phases (for example, before and after a consolidation or breakout).
All computations are done locally on the chart — the indicator does not place trades or alter candles.
In short, this script provides a compact visual and statistical summary of market volume distribution between rising and falling candles in a chosen date window, offering insight into the dominant market force during that time range.
보호된 스크립트입니다
이 스크립트는 비공개 소스로 게시됩니다. 하지만 이를 자유롭게 제한 없이 사용할 수 있습니다 – 자세한 내용은 여기에서 확인하세요.
면책사항
해당 정보와 게시물은 금융, 투자, 트레이딩 또는 기타 유형의 조언이나 권장 사항으로 간주되지 않으며, 트레이딩뷰에서 제공하거나 보증하는 것이 아닙니다. 자세한 내용은 이용 약관을 참조하세요.
면책사항
해당 정보와 게시물은 금융, 투자, 트레이딩 또는 기타 유형의 조언이나 권장 사항으로 간주되지 않으며, 트레이딩뷰에서 제공하거나 보증하는 것이 아닙니다. 자세한 내용은 이용 약관을 참조하세요.