OPEN-SOURCE SCRIPT
업데이트됨 MTF PO3 Big Candle By Rouro
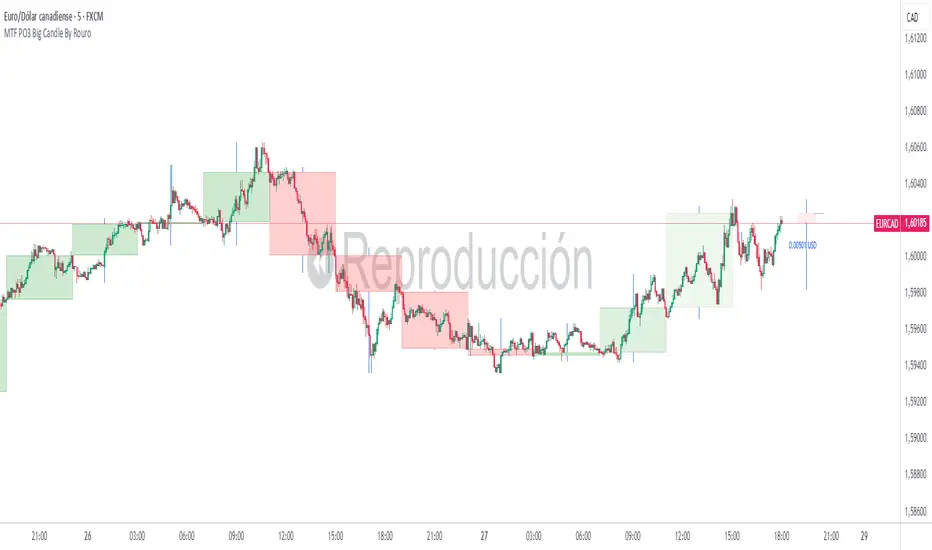
📊 MTF PO3 Big Candle By Rouro
This indicator allows you to visualize candles from higher timeframes (HTF) directly on lower timeframe charts.
It draws:
📉 Past candles from the selected HTF.
📈 A projected current candle of a chosen timeframe, extended to the right of the chart.
It's ideal for traders who want to align decisions on lower timeframes with key HTF structures.
⚙️ Inputs & Configuration
🕐 Past Candle Timeframe
Selects the timeframe to visualize historical candles.
(e.g., 4H on a 5-minute chart)
📅 Projected Candle Timeframe
Chooses the timeframe for the current (live) candle that is drawn to the right of the chart.
(e.g., 1D)
➡️ Right Displacement (bars)
Controls how far to the right the projected candle is drawn.
🟩 Bullish Body Color
Defines the color of bullish candle bodies.
🟥 Bearish Body Color
Defines the color of bearish candle bodies.
🔵 Wick Color
Color of the high/low wicks.
🔲 Body Transparency (0–100)
Controls the transparency of the candle body fill.
📌 Show Wicks
Enables or disables drawing of the wicks on all candles.
💡 Notes
If the projected candle is from a very large timeframe (e.g., 1D) and you are on a small timeframe (e.g., 5m), the projection length is limited to avoid overlapping the chart.
All candle shapes update in real time.
The indicator is optimized for performance and includes fail-safes for TradingView's limits.
💬 Support
If you have any questions, feel free to ask in the comments.
If this indicator has been useful or valuable for your trading, please leave a comment saying so — your feedback helps the community and supports the publication process.
✅ Compliant with TradingView’s house rules: No ads, sales, links, or misleading claims.
📌 This is a visual utility tool designed to support multi-timeframe analysis.
릴리즈 노트
📊 MTF PO3 Big Candle By RouroThis indicator allows you to visualize candles from higher timeframes (HTF) directly on lower timeframe charts.
It draws:
📉 Past candles from the selected HTF.
📈 A projected current candle of a chosen timeframe, extended to the right of the chart.
It's ideal for traders who want to align decisions on lower timeframes with key HTF structures.
⚙️ Inputs & Configuration
🕐 Past Candle Timeframe
Selects the timeframe to visualize historical candles.
(e.g., 4H on a 5-minute chart)
📅 Projected Candle Timeframe
Chooses the timeframe for the current (live) candle that is drawn to the right of the chart.
(e.g., 1D)
➡️ Right Displacement (bars)
Controls how far to the right the projected candle is drawn.
🟩 Bullish Body Color
Defines the color of bullish candle bodies.
🟥 Bearish Body Color
Defines the color of bearish candle bodies.
🔵 Wick Color
Color of the high/low wicks.
🔲 Body Transparency (0–100)
Controls the transparency of the candle body fill.
📌 Show Wicks
Enables or disables drawing of the wicks on all candles.
💡 Notes
If the projected candle is from a very large timeframe (e.g., 1D) and you are on a small timeframe (e.g., 5m), the projection length is limited to avoid overlapping the chart.
All candle shapes update in real time.
The indicator is optimized for performance and includes fail-safes for TradingView's limits.
💬 Support
If you have any questions, feel free to ask in the comments.
If this indicator has been useful or valuable for your trading, please leave a comment saying so — your feedback helps the community and supports the publication process.
✅ Compliant with TradingView’s house rules: No ads, sales, links, or misleading claims.
📌 This is a visual utility tool designed to support multi-timeframe analysis.
Update 1.2The error that the last candle was not marked correctly has been fixed.
오픈 소스 스크립트
트레이딩뷰의 진정한 정신에 따라, 이 스크립트의 작성자는 이를 오픈소스로 공개하여 트레이더들이 기능을 검토하고 검증할 수 있도록 했습니다. 작성자에게 찬사를 보냅니다! 이 코드는 무료로 사용할 수 있지만, 코드를 재게시하는 경우 하우스 룰이 적용된다는 점을 기억하세요.
면책사항
해당 정보와 게시물은 금융, 투자, 트레이딩 또는 기타 유형의 조언이나 권장 사항으로 간주되지 않으며, 트레이딩뷰에서 제공하거나 보증하는 것이 아닙니다. 자세한 내용은 이용 약관을 참조하세요.
오픈 소스 스크립트
트레이딩뷰의 진정한 정신에 따라, 이 스크립트의 작성자는 이를 오픈소스로 공개하여 트레이더들이 기능을 검토하고 검증할 수 있도록 했습니다. 작성자에게 찬사를 보냅니다! 이 코드는 무료로 사용할 수 있지만, 코드를 재게시하는 경우 하우스 룰이 적용된다는 점을 기억하세요.
면책사항
해당 정보와 게시물은 금융, 투자, 트레이딩 또는 기타 유형의 조언이나 권장 사항으로 간주되지 않으며, 트레이딩뷰에서 제공하거나 보증하는 것이 아닙니다. 자세한 내용은 이용 약관을 참조하세요.