INVITE-ONLY SCRIPT
업데이트됨 Wave Master
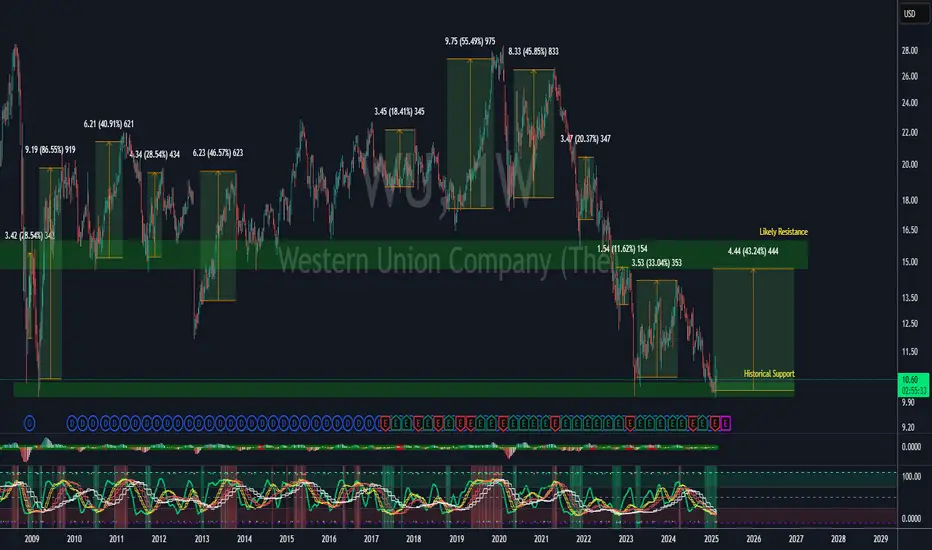
This indicator is built on Stochastics and pulls data from multiple timeframes to give you a birds eye view on where your asset is at a point in time. There are several factors that go into this indicator:
OVERBOUGHT
When all waves have all migrated to the overbought area, this is a high probability area to go short or take profit off the table.
OVERSOLD
When all waves have migrated to the oversold area, typically this indicates a high probability place to take a long position or purchase some equity.
VISUAL AIDS
Several visual aids have been included in this indicator to assist you, as a trader, to help you easily see what is going on.
- Upper/Lower Dots - Green/Yellow/Red dots indicate a cross has occurred. Each color corresponding with the wave in the indicator
- Color Coded Background - Red indicates green/yellow wave have gone into overbought territory and green background indicates green/yellow wave have gone into oversold territory. White slices in the background indicate the green has crossed (while in overbought/oversold)
- 12h/daily candle confirmation - When the 12hr (crypto) or daily (stocks) have crossed, a bright green or bright red candle will appear in the chart to help you indicate a potential for a change in trend
릴리즈 노트
Several updates are included in this release. Please read the release notes below**FOUR TRADING MODES**
Scalp - Must use on 1 minute timeframe - This mode is designed to be used for quick positions that typically last 5-20 minutes.
Day - Used for day trading and needs to be used on 15 minute timeframes - This mode is designed to be used for positions that last anywhere from 30 minute to 4 hours.
Swing - Default Mode - Must be used on 1 hour timeframe - This is the mode that was previously the only mode for the wave master indicator and is the default mode in this update - These trades typically last 1-4 days
Swing-htf - Must be used on 4 hour timeframe - Trades taken using this mode require a lot of patience and/or set and forget mentality and should expect to last several days to several weeks.
Note: Guru mode is still in development and is in an experimental mode currently.
릴리즈 노트
Major enhancements to the indicator include dynamic adjustment of the waves as you change the timeframe on your chart.Supported timeframes currently include: 1, 3, 5, 10, 15, 30, 45, 60, 120, 180, 240, 1D
The modes that previously existed such as scalp, day, swing and swing-htf have been removed as the chart automatically adjusts when moving to those timeframes.
Note: Manual override is currently unused and will be included in a later release.
릴리즈 노트
New features have been included in this revision:Modes have been brought back due to popular demand with two new modes added: dynamic (default) and override.
- Dynamic Mode will continue to dynamically update the wave timeframes used as you change the timeframe of your chart
- Override Mode will allow you to specify the wave timeframes you want to use in the event you use nonstandard timeframes
A Detail mode has also been introduced. This will allow you to reduce clutter and only show the fast wave of the green/yellow/red waves. This will hide the slow wave, but you will still be able to utilize the circle helpers at the top and bottom of the indicator to visually identify wave crosses.
Unrelated to what users visually see, code has been cleaned up and optimized to run slightly quicker.
릴리즈 노트
UPDATE 01-JAN-2023:The update included in this is not functionally different from before. Due to customer requests, I have added the ability to adjust the overbought and oversold thresholds.
릴리즈 노트
This update to the wave master indicator includes more dynamic options for higher timeframes by popular request. Specifically, adding additional support for Weekly timeframes and Monthly timeframes.초대 전용 스크립트
이 스크립트는 작성자가 승인한 사용자만 접근할 수 있습니다. 사용하려면 요청 후 승인을 받아야 하며, 일반적으로 결제 후에 허가가 부여됩니다. 자세한 내용은 아래 작성자의 안내를 따르거나 bitdoctor에게 직접 문의하세요.
트레이딩뷰는 스크립트의 작동 방식을 충분히 이해하고 작성자를 완전히 신뢰하지 않는 이상, 해당 스크립트에 비용을 지불하거나 사용하는 것을 권장하지 않습니다. 커뮤니티 스크립트에서 무료 오픈소스 대안을 찾아보실 수도 있습니다.
작성자 지시 사항
Please DM for information on how to obtain this indicator
CE - BitDoctor
Access our private indicators and join our Premium Room: bitdoctor.org
Beware of scams - I'll never DM you asking for funds.
Access our private indicators and join our Premium Room: bitdoctor.org
Beware of scams - I'll never DM you asking for funds.
면책사항
해당 정보와 게시물은 금융, 투자, 트레이딩 또는 기타 유형의 조언이나 권장 사항으로 간주되지 않으며, 트레이딩뷰에서 제공하거나 보증하는 것이 아닙니다. 자세한 내용은 이용 약관을 참조하세요.
초대 전용 스크립트
이 스크립트는 작성자가 승인한 사용자만 접근할 수 있습니다. 사용하려면 요청 후 승인을 받아야 하며, 일반적으로 결제 후에 허가가 부여됩니다. 자세한 내용은 아래 작성자의 안내를 따르거나 bitdoctor에게 직접 문의하세요.
트레이딩뷰는 스크립트의 작동 방식을 충분히 이해하고 작성자를 완전히 신뢰하지 않는 이상, 해당 스크립트에 비용을 지불하거나 사용하는 것을 권장하지 않습니다. 커뮤니티 스크립트에서 무료 오픈소스 대안을 찾아보실 수도 있습니다.
작성자 지시 사항
Please DM for information on how to obtain this indicator
CE - BitDoctor
Access our private indicators and join our Premium Room: bitdoctor.org
Beware of scams - I'll never DM you asking for funds.
Access our private indicators and join our Premium Room: bitdoctor.org
Beware of scams - I'll never DM you asking for funds.
면책사항
해당 정보와 게시물은 금융, 투자, 트레이딩 또는 기타 유형의 조언이나 권장 사항으로 간주되지 않으며, 트레이딩뷰에서 제공하거나 보증하는 것이 아닙니다. 자세한 내용은 이용 약관을 참조하세요.