OPEN-SOURCE SCRIPT
Periodic price change comparison
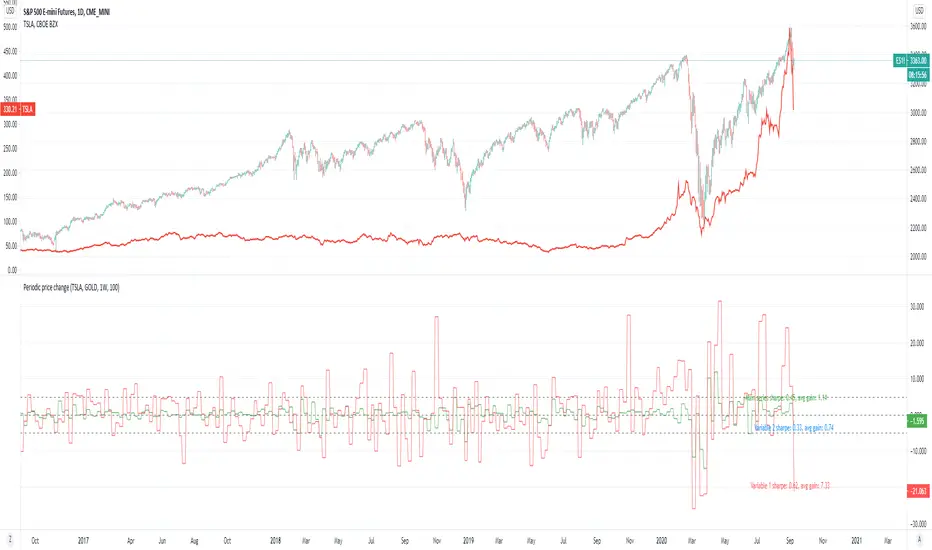
Periodic price change.
Application:
Sector rotation analysis by comparing different tickers.
Simple statistical analysis (with lookback period) for knowing how good they were.
If you are a believer in sector rotation, you can add different sector stocks to see which of them are lagged behind and buy them.
In this example, you could see tesla periodically fall behind the market. You can buy it when it is on that zone.
And you can also refer to the sharpe ratio and the average gain rate on the chart to see how good the stocks were.
오픈 소스 스크립트
트레이딩뷰의 진정한 정신에 따라, 이 스크립트의 작성자는 이를 오픈소스로 공개하여 트레이더들이 기능을 검토하고 검증할 수 있도록 했습니다. 작성자에게 찬사를 보냅니다! 이 코드는 무료로 사용할 수 있지만, 코드를 재게시하는 경우 하우스 룰이 적용된다는 점을 기억하세요.
면책사항
해당 정보와 게시물은 금융, 투자, 트레이딩 또는 기타 유형의 조언이나 권장 사항으로 간주되지 않으며, 트레이딩뷰에서 제공하거나 보증하는 것이 아닙니다. 자세한 내용은 이용 약관을 참조하세요.
오픈 소스 스크립트
트레이딩뷰의 진정한 정신에 따라, 이 스크립트의 작성자는 이를 오픈소스로 공개하여 트레이더들이 기능을 검토하고 검증할 수 있도록 했습니다. 작성자에게 찬사를 보냅니다! 이 코드는 무료로 사용할 수 있지만, 코드를 재게시하는 경우 하우스 룰이 적용된다는 점을 기억하세요.
면책사항
해당 정보와 게시물은 금융, 투자, 트레이딩 또는 기타 유형의 조언이나 권장 사항으로 간주되지 않으며, 트레이딩뷰에서 제공하거나 보증하는 것이 아닙니다. 자세한 내용은 이용 약관을 참조하세요.