OPEN-SOURCE SCRIPT
Ultimate MACD
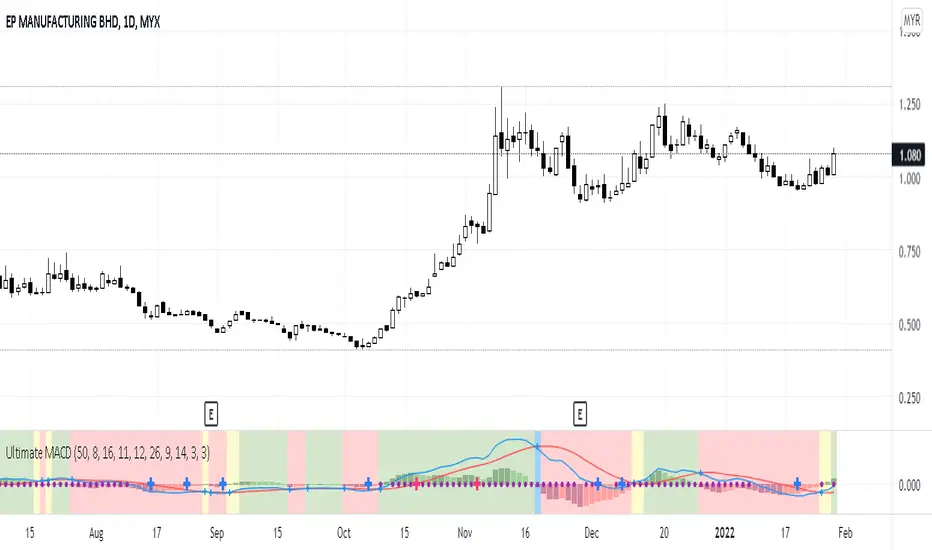
This indicator is an improved version of MACD+RSI (refer to my script list). Basically, this indicator is a combination of several indicators:
1. Fast MACD (preset at 8, 16, 11 - it is my own preference settings and the red and blue line in this indicator are referring to the Fast MACD settings)
2. Slow MACD (preset at 12, 26, 9 - standard settings and the Slow MACD lines are not displayed in this indicator)
3. RSI (preset over value 50)
4. Stochastic (preset overbought at 80, oversold at 20)
How to read:
1. Fast and Slow MACD:
- Two red and blue lines are displaying the Fast MACD lines
- Small blue cross will appear at every crossover of the Fast MACD lines
- Golden Cross 1: Yellow background will appear if only Fast MACD lines are crossing to each other (blue crossover red)
- Golden Cross 2: Green background will appear if both Fast and Slow MACD lines are crossing to each other (blue crossover red but for Slow MACD, I didn't put those lines in this indicator)
- Death Cross 1: Blue background will appear if only Fast MACD lines are crossing to each other (red crossover blue)
- Death Cross 2: Red background will appear if both Fast and Slow MACD lines are crossing to each other (red crossover blue)
2. RSI:
- Purple dots will appear on the center line if RSI value is over 50
3. Stochastic:
- Big Blue cross will appear on the center line if stochastic line are crossing to each other in the oversold area (preset at 20)
- Big Red cross will appear on the center line if stochastic line are crossing to each other in the overbought area (preset at 80)
That's all about this indicator, you can use it based on your own trading style if it suits you. And again I let the script open for anyone to modify it based on your own preferences.
오픈 소스 스크립트
트레이딩뷰의 진정한 정신에 따라, 이 스크립트의 작성자는 이를 오픈소스로 공개하여 트레이더들이 기능을 검토하고 검증할 수 있도록 했습니다. 작성자에게 찬사를 보냅니다! 이 코드는 무료로 사용할 수 있지만, 코드를 재게시하는 경우 하우스 룰이 적용된다는 점을 기억하세요.
면책사항
해당 정보와 게시물은 금융, 투자, 트레이딩 또는 기타 유형의 조언이나 권장 사항으로 간주되지 않으며, 트레이딩뷰에서 제공하거나 보증하는 것이 아닙니다. 자세한 내용은 이용 약관을 참조하세요.
오픈 소스 스크립트
트레이딩뷰의 진정한 정신에 따라, 이 스크립트의 작성자는 이를 오픈소스로 공개하여 트레이더들이 기능을 검토하고 검증할 수 있도록 했습니다. 작성자에게 찬사를 보냅니다! 이 코드는 무료로 사용할 수 있지만, 코드를 재게시하는 경우 하우스 룰이 적용된다는 점을 기억하세요.
면책사항
해당 정보와 게시물은 금융, 투자, 트레이딩 또는 기타 유형의 조언이나 권장 사항으로 간주되지 않으며, 트레이딩뷰에서 제공하거나 보증하는 것이 아닙니다. 자세한 내용은 이용 약관을 참조하세요.