OPEN-SOURCE SCRIPT
업데이트됨 4 EMA & MACD
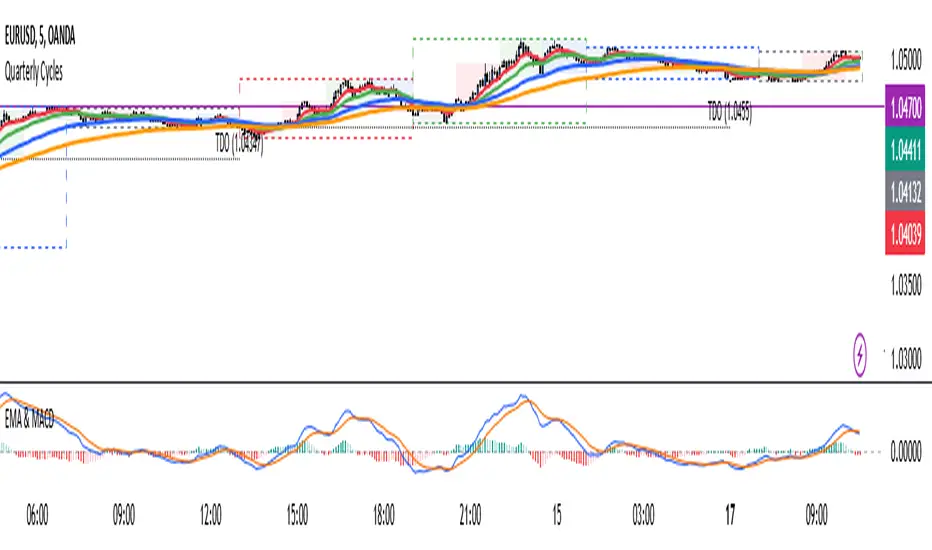
The indicator that combines Moving Average and MACD into one is very useful for providing a more complete picture of the market. Here's how it works:
Moving Average (MA): This is a trend indicator that smooths the price to show the dominant trend direction. MA helps traders determine whether the market is in an uptrend, downtrend, or sideways. For example, if the price is above the MA, it might indicate an uptrend, while if the price is below the MA, it might indicate a downtrend.
MACD (Moving Average Convergence Divergence): MACD measures market momentum and can provide entry and exit signals based on the difference between two moving averages (fast MA and slow MA). A buy signal occurs when the MACD crosses above the signal line, and a sell signal occurs when the MACD crosses below the signal line.
Combining both gives traders a more complete view:
MA provides an overview of the larger trend direction.
MACD helps identify moments when momentum supports a position for entering or exiting.
Common usage:
Entry: If the price is above the Moving Average (uptrend) and the MACD shows a buy signal (for example, MACD crossing above the signal line), it can be a signal to buy.
Exit: If the price starts moving below the MA and the MACD shows a sell signal, it can be a signal to sell or exit the position.
There is an indicator called MACD + Moving Average Cross, which combines both elements, providing stronger signals and making it easier to follow the market.
릴리즈 노트
update visual effect on MACD릴리즈 노트
Update the display of indicator settings릴리즈 노트
This custom indicator combines Exponential Moving Averages (EMA) with a switchable RSI/MACD feature. Users can display four EMAs and toggle between RSI and MACD based on their trading preferences.릴리즈 노트
I removed RSI from this indicator and changed it to the previous version without RSI.릴리즈 노트
Indikator ini menggabungkan tiga elemen utama dalam strategi trading, yaitu Exponential Moving Average (EMA), Moving Average Convergence Divergence (MACD), dan Average True Range (ATR) Stop Loss. EMA digunakan untuk mengidentifikasi tren pasar dengan melihat pergerakan harga rata-rata dalam berbagai periode waktu. Kombinasi beberapa EMA membantu trader menentukan arah tren, mengidentifikasi potensi pembalikan, serta menemukan area support dan resistance dinamis.MACD berfungsi untuk mengukur kekuatan tren dan momentum harga. Indikator ini membantu trader mengenali perubahan tren berdasarkan hubungan antara dua moving average serta histogram yang menunjukkan perbedaan di antara keduanya. Sinyal yang dihasilkan dapat digunakan untuk menentukan potensi entry dan exit berdasarkan perubahan momentum pasar.
Sementara itu, ATR Stop Loss digunakan sebagai alat manajemen risiko dengan menentukan level stop loss yang menyesuaikan dengan volatilitas pasar. Saat volatilitas tinggi, jarak stop loss akan lebih luas untuk menghindari stop out prematur, sedangkan saat volatilitas rendah, stop loss akan lebih ketat untuk meminimalkan risiko. Kombinasi ketiga indikator ini memungkinkan trader untuk mengikuti tren dengan lebih efektif, mendapatkan konfirmasi entry yang lebih kuat, serta mengelola risiko secara lebih adaptif sesuai kondisi pasar.
릴리즈 노트
adding ATR Stoploss feature.오픈 소스 스크립트
트레이딩뷰의 진정한 정신에 따라, 이 스크립트의 작성자는 이를 오픈소스로 공개하여 트레이더들이 기능을 검토하고 검증할 수 있도록 했습니다. 작성자에게 찬사를 보냅니다! 이 코드는 무료로 사용할 수 있지만, 코드를 재게시하는 경우 하우스 룰이 적용된다는 점을 기억하세요.
면책사항
해당 정보와 게시물은 금융, 투자, 트레이딩 또는 기타 유형의 조언이나 권장 사항으로 간주되지 않으며, 트레이딩뷰에서 제공하거나 보증하는 것이 아닙니다. 자세한 내용은 이용 약관을 참조하세요.
오픈 소스 스크립트
트레이딩뷰의 진정한 정신에 따라, 이 스크립트의 작성자는 이를 오픈소스로 공개하여 트레이더들이 기능을 검토하고 검증할 수 있도록 했습니다. 작성자에게 찬사를 보냅니다! 이 코드는 무료로 사용할 수 있지만, 코드를 재게시하는 경우 하우스 룰이 적용된다는 점을 기억하세요.
면책사항
해당 정보와 게시물은 금융, 투자, 트레이딩 또는 기타 유형의 조언이나 권장 사항으로 간주되지 않으며, 트레이딩뷰에서 제공하거나 보증하는 것이 아닙니다. 자세한 내용은 이용 약관을 참조하세요.