PROTECTED SOURCE SCRIPT
OGT Bollinger Bands Trend Indicator
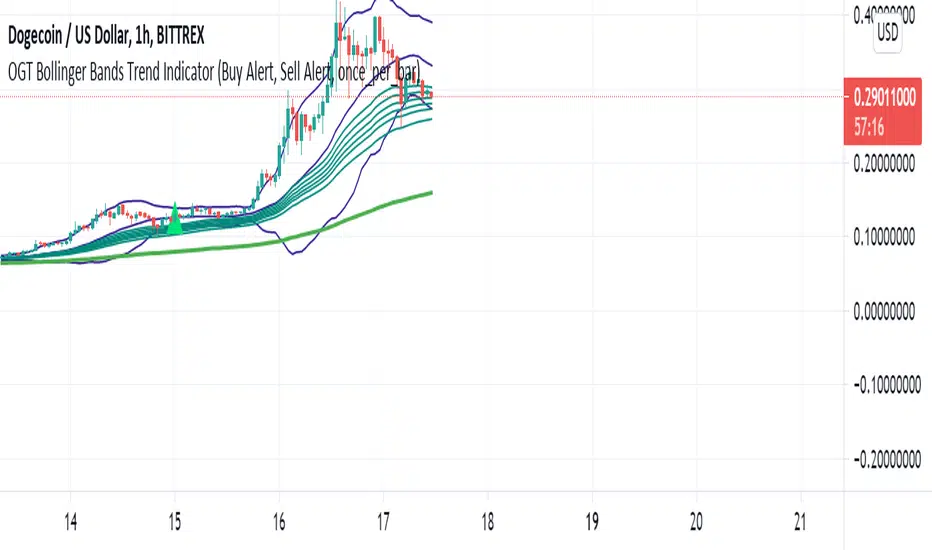
What Is The OGT Bollinger Bands Trend Indicator?
This indicator is a pullback trend trading indicator which uses the following indicators:
- 200 EMA - Long Term Trend Direction
- 30, 35, 40, 45, 50, 60 EMAs - Shorter Term Trend Direction
- Bollinger Bands - Pullback / Entry Signal
How Are Signals Generated?
Buy
- Price above the 200 EMA
- Price touches lower BB with shorter term EMAs all aligned (not crossed)
- Indicator waits for price to close above midpoint BB with shorter term EMAs all still aligned (not crossed)
Sell
- Price below the 200 EMA
- Price touches upper BB with shorter term EMAs all aligned (not crossed)
- Indicator waits for price to close above midpoint BB with shorter term EMAs all still aligned (not crossed)
Alerts function built in, input settings customisable to show/not show indicators and change colours.
보호된 스크립트입니다
이 스크립트는 비공개 소스로 게시됩니다. 하지만 이를 자유롭게 제한 없이 사용할 수 있습니다 – 자세한 내용은 여기에서 확인하세요.
면책사항
해당 정보와 게시물은 금융, 투자, 트레이딩 또는 기타 유형의 조언이나 권장 사항으로 간주되지 않으며, 트레이딩뷰에서 제공하거나 보증하는 것이 아닙니다. 자세한 내용은 이용 약관을 참조하세요.
보호된 스크립트입니다
이 스크립트는 비공개 소스로 게시됩니다. 하지만 이를 자유롭게 제한 없이 사용할 수 있습니다 – 자세한 내용은 여기에서 확인하세요.
면책사항
해당 정보와 게시물은 금융, 투자, 트레이딩 또는 기타 유형의 조언이나 권장 사항으로 간주되지 않으며, 트레이딩뷰에서 제공하거나 보증하는 것이 아닙니다. 자세한 내용은 이용 약관을 참조하세요.