OPEN-SOURCE SCRIPT
업데이트됨 Trend Strength Gauge
Trend Strength Gauge with Modified Hull Moving Average (HMA)
Overview:
The indicator combines a modified Hull Moving Average (HMA) with a visual gauge that represents the strength and direction of the current trend. This helps traders quickly assess the trend's vigor and direction.
Key Features:
Modified Hull Moving Average (HMA):
Purpose: The HMA is a smoothed moving average designed to reduce lag and provide more responsive trend signals.
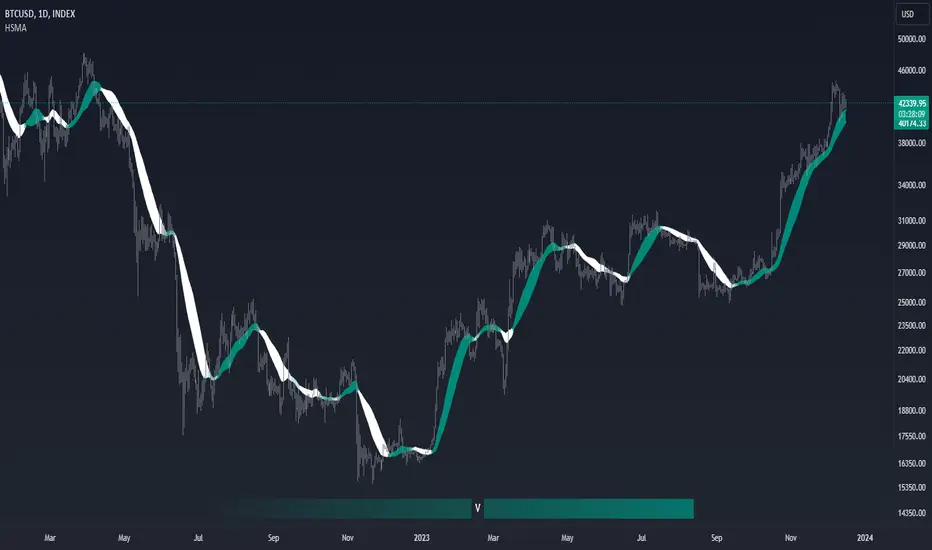
The indicator displays two HMA line and SMA line on the chart and fill color between them
based on HMA is above SMA or not.
Trend Strength Gauge:
Visualization: Below the chart, there's a gauge represented by gradient line gauge with "V" symbol.
The gauge line change color based on the direction of the trend.
Additionally, symbol "V" moves from solid color to transparent, indicating the trend's strength gradient.
Up Trend:

Dn Trend:

Trend Assessment:
Usage:
This combined indicator simplifies trend analysis by offering an easily understandable visual representation of trend strength and direction.
Remember, while indicators are valuable tools, successful trading requires a comprehensive approach that incorporates multiple sources of information and risk management strategies.
Always exercise caution, apply critical thinking, and consider the broader market context when using indicators to make informed trading decisions.
Overview:
The indicator combines a modified Hull Moving Average (HMA) with a visual gauge that represents the strength and direction of the current trend. This helps traders quickly assess the trend's vigor and direction.
Key Features:
Modified Hull Moving Average (HMA):
Purpose: The HMA is a smoothed moving average designed to reduce lag and provide more responsive trend signals.
The indicator displays two HMA line and SMA line on the chart and fill color between them
based on HMA is above SMA or not.
Trend Strength Gauge:
Visualization: Below the chart, there's a gauge represented by gradient line gauge with "V" symbol.
The gauge line change color based on the direction of the trend.
Additionally, symbol "V" moves from solid color to transparent, indicating the trend's strength gradient.
Up Trend:
Dn Trend:
Trend Assessment:
- When "V" at the strong teal collor it represents a strong positive trend (uptrend).
- When "V" at the strong white collor it Indicates a strong negative trend (downtrend).
- Arrow Movement: The symbol 'V' transitions from a solid color (teal or white) to a more transparent shade based on the strength of the trend.
Usage:
- Trend Confirmation: Traders can use this indicator to confirm trends and assess their strength before making trading decisions.
- Entry/Exit Points: The changing colors and transparency levels of the 'V' symbols can assist in identifying potential entry or exit points.
- Can be used as a simple Hull indicator
This combined indicator simplifies trend analysis by offering an easily understandable visual representation of trend strength and direction.
Remember, while indicators are valuable tools, successful trading requires a comprehensive approach that incorporates multiple sources of information and risk management strategies.
Always exercise caution, apply critical thinking, and consider the broader market context when using indicators to make informed trading decisions.
릴리즈 노트
-릴리즈 노트
Theming:오픈 소스 스크립트
트레이딩뷰의 진정한 정신에 따라, 이 스크립트의 작성자는 이를 오픈소스로 공개하여 트레이더들이 기능을 검토하고 검증할 수 있도록 했습니다. 작성자에게 찬사를 보냅니다! 이 코드는 무료로 사용할 수 있지만, 코드를 재게시하는 경우 하우스 룰이 적용된다는 점을 기억하세요.
면책사항
해당 정보와 게시물은 금융, 투자, 트레이딩 또는 기타 유형의 조언이나 권장 사항으로 간주되지 않으며, 트레이딩뷰에서 제공하거나 보증하는 것이 아닙니다. 자세한 내용은 이용 약관을 참조하세요.
오픈 소스 스크립트
트레이딩뷰의 진정한 정신에 따라, 이 스크립트의 작성자는 이를 오픈소스로 공개하여 트레이더들이 기능을 검토하고 검증할 수 있도록 했습니다. 작성자에게 찬사를 보냅니다! 이 코드는 무료로 사용할 수 있지만, 코드를 재게시하는 경우 하우스 룰이 적용된다는 점을 기억하세요.
면책사항
해당 정보와 게시물은 금융, 투자, 트레이딩 또는 기타 유형의 조언이나 권장 사항으로 간주되지 않으며, 트레이딩뷰에서 제공하거나 보증하는 것이 아닙니다. 자세한 내용은 이용 약관을 참조하세요.