INVITE-ONLY SCRIPT
업데이트됨 algoat ProKit (Early Access)
The market is constantly changing and fluctuating. Prices rise and fall, influenced by a multitude of factors. ProKit is here to help you reveal and understand these factors. Discover the market dynamics, cut through the noise, follow trends, anticipate potential reversals, and be ready to react when the time comes!
⭐ Features:
Multi-Timeframe Moving Averages
Cut through the noise, identify trends and turning points with 5 multi-timeframe moving averages with a variety of settings.
Divergence Fusion Engine
Reveal, combine and display dozens of indicator divergences on your chart and rank them by their performance.
algoat TMC™ (Trend Matrix Core) algorithm visualized
Deploy our flexible Moving Average matrix, designed to assess market trend direction, strength, and shifts.
Previous OHLC data
Stay informed by analyzing current and historical Previous Open/High/Low/Close price values in your preferred timeframe.
══════════════════
Multi-Timeframe Moving Averages
This feature allows traders to simultaneously monitor moving averages across multiple timeframes, providing a comprehensive perspective on market trends. It helps identify dynamic support and resistance zones, key levels where price movements are likely to slow down or reverse. This function not only aids in planning potential trade entries and exits, but also calculates the precise percentage distance to these levels. Can also be crucial for risk management, as they allow traders to set stop losses and profit targets based on solid, data-driven analysis. The Multi-Timeframe Moving Averages function is a versatile tool that combines strategic planning and risk control into a single, easy-to-use feature.
SNAPSHOT
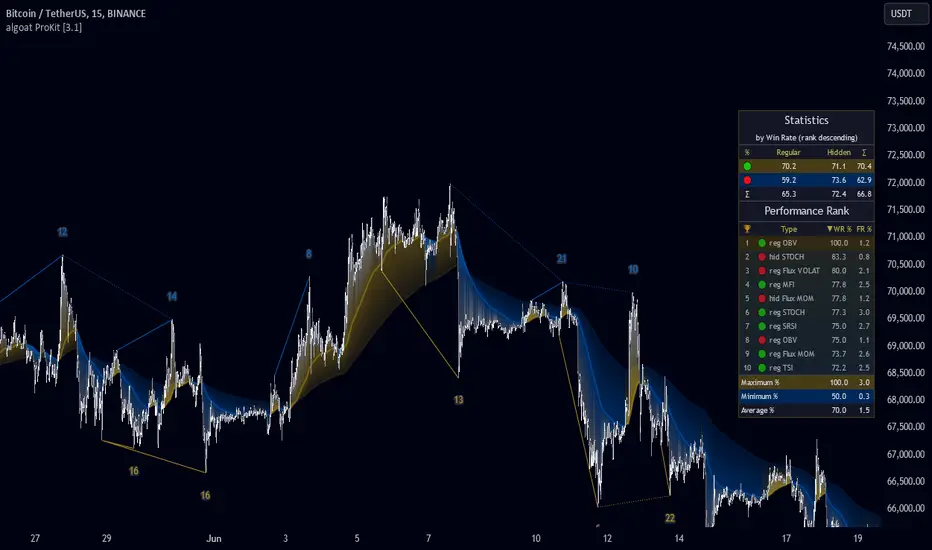
Divergence Fusion Engine
The engine allows the use of unique indicators along with our proprietary ones to detect potential price reversals. Additionally, set theory's Union and Intersection operators simplify the exploration of divergence combinations. For example, if you're interested in identifying rare situations where selected indicators diverge simultaneously, it's just a few clicks away.
As each asset has a different market maker, divergences can vary greatly across different charts and timeframes. With our Divergence Performance Rank, you can quickly determine which divergences have the highest success rates and which are the least successful on a given chart. This feature allows you to adapt your strategies to the most effective signals, enhancing your trading decisions and boosting your potential profits.
SNAPSHOT
Trend Matrix Core
This 21st-century tool utilizes simple visualization techniques to present trend information in an intuitive, easily interpretable manner. It is tailored for the modern trader who values both precision and simplicity. The calculation is based on our unique algoat TMC™ (Trend Matrix Core) algorithm: a flexible Moving Average matrix, designed to assess market trend direction, strength, and shifts. It complements algoat SMC Core™ as confluence.
The general trend direction of the asset can be identified by looking at the slope of the Trend Matrix Core: pointing up, the asset is in an uptrend, pointing down, the asset is in a downtrend. The indicator can also be used to assess the strength of a trend, identify potential resistance and support levels, and manage risk. Trend edges (lines) can be used as potential entries or targets, depending on the situation.
SNAPSHOT

SNAPSHOT
══════════════════
🧠 General advice
Trading effectively requires a range of techniques, experience, and expertise. From technical analysis to market fundamentals, traders must navigate multiple factors, including market sentiment and economic conditions. However, traders often find themselves overwhelmed by market noise, making it challenging to filter out distractions and make informed decisions. By integrating multiple analytical approaches, traders can tailor their strategies to fit their unique trading styles and objectives.
Confirming signals with other indicators
As with all technical indicators, it is important to confirm potential signals with other analytical tools, such as support and resistance levels, as well as indicators like RSI, MACD, and volume. This helps increase the probability of a successful trade.
Use proper risk management
When using this or any other indicator, it is crucial to have proper risk management in place. Consider implementing stop-loss levels and thoughtful position sizing.
Combining with other technical indicators
Integrate this indicator with other technical indicators to develop a comprehensive trading strategy and provide additional confirmation.
Conduct Thorough Research and Backtesting
Ensure a solid understanding of the indicator and its behavior through thorough research and backtesting before making trading decisions. Consider incorporating fundamental analysis and market sentiment into your trading approach.
══════════════════
⭐ Conclusion
We hold the view that the true path to success is the synergy between the trader and the tool, contrary to the common belief that the tool itself is the sole determinant of profitability. The actual scenario is more nuanced than such an oversimplification. A word to the wise is enough: developed by traders, for traders — pioneering innovations for the modern era.
Risk Notice
Everything provided by algoat — from scripts, tools, and articles to educational materials — is intended solely for educational and informational purposes. Past performance does not assure future returns.
⭐ Features:
Multi-Timeframe Moving Averages
Cut through the noise, identify trends and turning points with 5 multi-timeframe moving averages with a variety of settings.
Divergence Fusion Engine
Reveal, combine and display dozens of indicator divergences on your chart and rank them by their performance.
algoat TMC™ (Trend Matrix Core) algorithm visualized
Deploy our flexible Moving Average matrix, designed to assess market trend direction, strength, and shifts.
Previous OHLC data
Stay informed by analyzing current and historical Previous Open/High/Low/Close price values in your preferred timeframe.
══════════════════
Multi-Timeframe Moving Averages
This feature allows traders to simultaneously monitor moving averages across multiple timeframes, providing a comprehensive perspective on market trends. It helps identify dynamic support and resistance zones, key levels where price movements are likely to slow down or reverse. This function not only aids in planning potential trade entries and exits, but also calculates the precise percentage distance to these levels. Can also be crucial for risk management, as they allow traders to set stop losses and profit targets based on solid, data-driven analysis. The Multi-Timeframe Moving Averages function is a versatile tool that combines strategic planning and risk control into a single, easy-to-use feature.
SNAPSHOT
Divergence Fusion Engine
The engine allows the use of unique indicators along with our proprietary ones to detect potential price reversals. Additionally, set theory's Union and Intersection operators simplify the exploration of divergence combinations. For example, if you're interested in identifying rare situations where selected indicators diverge simultaneously, it's just a few clicks away.
As each asset has a different market maker, divergences can vary greatly across different charts and timeframes. With our Divergence Performance Rank, you can quickly determine which divergences have the highest success rates and which are the least successful on a given chart. This feature allows you to adapt your strategies to the most effective signals, enhancing your trading decisions and boosting your potential profits.
SNAPSHOT
Trend Matrix Core
This 21st-century tool utilizes simple visualization techniques to present trend information in an intuitive, easily interpretable manner. It is tailored for the modern trader who values both precision and simplicity. The calculation is based on our unique algoat TMC™ (Trend Matrix Core) algorithm: a flexible Moving Average matrix, designed to assess market trend direction, strength, and shifts. It complements algoat SMC Core™ as confluence.
The general trend direction of the asset can be identified by looking at the slope of the Trend Matrix Core: pointing up, the asset is in an uptrend, pointing down, the asset is in a downtrend. The indicator can also be used to assess the strength of a trend, identify potential resistance and support levels, and manage risk. Trend edges (lines) can be used as potential entries or targets, depending on the situation.
SNAPSHOT
SNAPSHOT
══════════════════
🧠 General advice
Trading effectively requires a range of techniques, experience, and expertise. From technical analysis to market fundamentals, traders must navigate multiple factors, including market sentiment and economic conditions. However, traders often find themselves overwhelmed by market noise, making it challenging to filter out distractions and make informed decisions. By integrating multiple analytical approaches, traders can tailor their strategies to fit their unique trading styles and objectives.
Confirming signals with other indicators
As with all technical indicators, it is important to confirm potential signals with other analytical tools, such as support and resistance levels, as well as indicators like RSI, MACD, and volume. This helps increase the probability of a successful trade.
Use proper risk management
When using this or any other indicator, it is crucial to have proper risk management in place. Consider implementing stop-loss levels and thoughtful position sizing.
Combining with other technical indicators
Integrate this indicator with other technical indicators to develop a comprehensive trading strategy and provide additional confirmation.
Conduct Thorough Research and Backtesting
Ensure a solid understanding of the indicator and its behavior through thorough research and backtesting before making trading decisions. Consider incorporating fundamental analysis and market sentiment into your trading approach.
══════════════════
⭐ Conclusion
We hold the view that the true path to success is the synergy between the trader and the tool, contrary to the common belief that the tool itself is the sole determinant of profitability. The actual scenario is more nuanced than such an oversimplification. A word to the wise is enough: developed by traders, for traders — pioneering innovations for the modern era.
Risk Notice
Everything provided by algoat — from scripts, tools, and articles to educational materials — is intended solely for educational and informational purposes. Past performance does not assure future returns.
릴리즈 노트
-릴리즈 노트
-릴리즈 노트
-릴리즈 노트
version 3.1.0- SMC Core and TMC algorithm update: sensitivity adjustments.
- Divergence signals are now entirely tied to confirmed temporal structural highs and lows (SMC Core algorithm).
- Flux indicators added (sentiment, momentum, trend strength, volume, volatility).
- New filters: Bullish, Bearish, Regular, Hidden, and single indicator instances.
- Fine-tuned combinatorics: filter to minimum divergence combinations.
- Fusion with intersection: show only those indicator divergences where both regular and hidden are present at the same time.
- Statistics: Totals, Aggregations (min, max, avg) by Win Rate or Frequency.
- Performance Rank: Order by Win Rate, Frequency; Limit results.
초대 전용 스크립트
이 스크립트는 작성자가 승인한 사용자만 접근할 수 있습니다. 사용하려면 요청 후 승인을 받아야 하며, 일반적으로 결제 후에 허가가 부여됩니다. 자세한 내용은 아래 작성자의 안내를 따르거나 algoat에게 직접 문의하세요.
이 비공개 초대 전용 스크립트는 스크립트 모더레이터의 검토를 거치지 않았으며, 하우스 룰 준수 여부는 확인되지 않았습니다. 트레이딩뷰는 스크립트의 작동 방식을 충분히 이해하고 작성자를 완전히 신뢰하지 않는 이상, 해당 스크립트에 비용을 지불하거나 사용하는 것을 권장하지 않습니다. 커뮤니티 스크립트에서 무료 오픈소스 대안을 찾아보실 수도 있습니다.
작성자 지시 사항
-
면책사항
해당 정보와 게시물은 금융, 투자, 트레이딩 또는 기타 유형의 조언이나 권장 사항으로 간주되지 않으며, 트레이딩뷰에서 제공하거나 보증하는 것이 아닙니다. 자세한 내용은 이용 약관을 참조하세요.