OPEN-SOURCE SCRIPT
Earnings Date Highlighter - from0_to_1
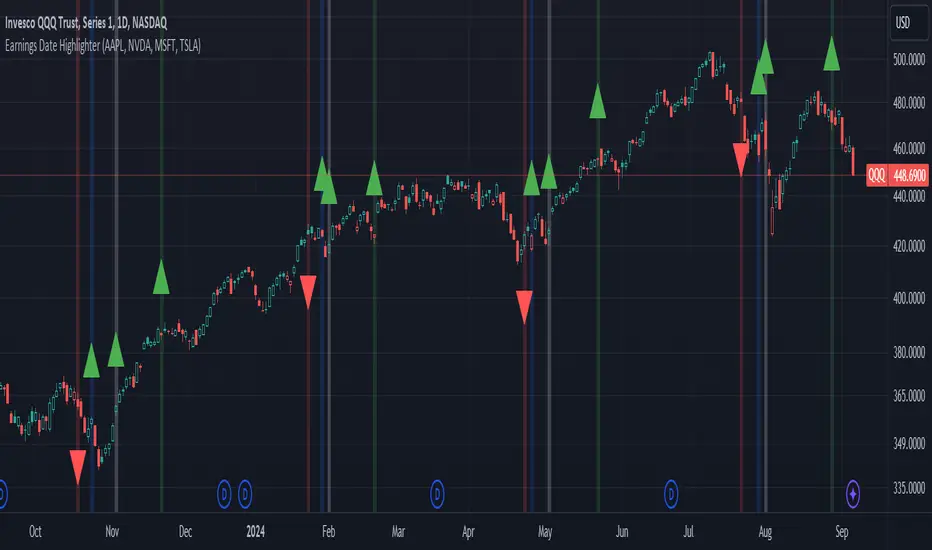
This indicator, called "Earnings Date Highlighter," is designed to visualize earnings data for up to four different stocks on a single chart. It's particularly useful for traders or investors who want to track earnings events for multiple companies simultaneously, such as the top holdings of an ETF.
Key features:
1. Tracks earnings data (estimates and actuals) for four user-defined symbols.
2. Plots earnings data points with customizable colors for each symbol.
3. Highlights earnings dates with background colors.
4. Displays green up arrows for earnings beats and red down arrows for earnings misses.
Why someone would use it:
1. To monitor earnings events for multiple stocks in a single view.
2. To quickly identify potential market-moving events for key components of an ETF or portfolio.
3. To spot patterns in earnings performance across different companies or sectors.
4. To help with timing trades or adjusting positions around earnings announcements.
This tool can be particularly valuable for investors focused on ETFs, as it allows them to visualize earnings dates and performance for the ETF's major holdings all in one place, potentially providing insights into how the ETF might behave around these key events.
Author:
tradingview.com/u/from0_to_1/
오픈 소스 스크립트
트레이딩뷰의 진정한 정신에 따라, 이 스크립트의 작성자는 이를 오픈소스로 공개하여 트레이더들이 기능을 검토하고 검증할 수 있도록 했습니다. 작성자에게 찬사를 보냅니다! 이 코드는 무료로 사용할 수 있지만, 코드를 재게시하는 경우 하우스 룰이 적용된다는 점을 기억하세요.
Disclaimer: Not a personal finance professional or financial advisor. Any and all publications are opinion and not investment advice.
면책사항
해당 정보와 게시물은 금융, 투자, 트레이딩 또는 기타 유형의 조언이나 권장 사항으로 간주되지 않으며, 트레이딩뷰에서 제공하거나 보증하는 것이 아닙니다. 자세한 내용은 이용 약관을 참조하세요.