OPEN-SOURCE SCRIPT
FCNC Spread
Title: FCNC Spread Indicator
Description:
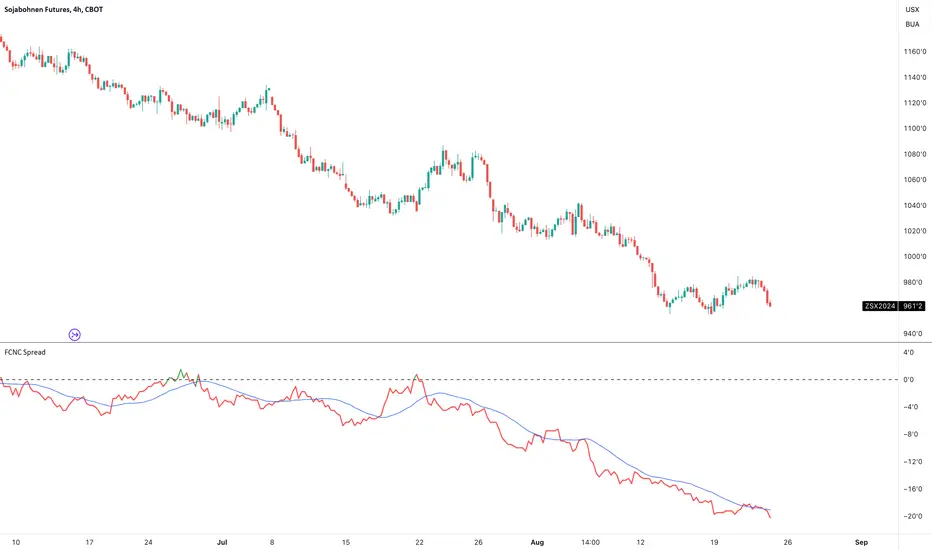
The FCNC Spread Indicator is designed to help traders analyze the price difference (spread) between two futures contracts: the front contract and the next contract. This type of analysis is commonly used in futures trading to identify market sentiment, arbitrage opportunities, and potential roll yield strategies.
How It Works:
Front Contract: The front contract represents the futures contract closest to expiration, often referred to as the near-month contract.
Next Contract: The next contract is the futures contract that follows the front contract in the expiration cycle, typically the next available month.
Spread Calculation: frontContract - nextContract represents the difference between the price of the front contract and the next contract.
Positive Spread: A positive value means that the front contract is more expensive than the next contract, indicating backwardation.
Negative Spread: A negative value means that the front contract is cheaper than the next contract, indicating contango.
How to Use:
Input Selection: Select your desired futures contracts for the front and next contract through the input settings. The script will fetch and calculate the closing prices of these contracts.
Spread Plotting: The calculated spread is plotted on the chart, with color-coding based on the spread's value (green for positive, red for negative).
Labeling: The spread value is dynamically labeled on the chart for quick reference.
Moving Average: A 20-period Simple Moving Average (SMA) of the spread is also plotted to help identify trends and smooth out fluctuations.
Applications:
Trend Identification: Analyze the spread to determine market sentiment and potential trend reversals.
Divergence Detection: Look for divergences between the spread and the underlying market to identify possible shifts in trend or market sentiment. Divergences can signal upcoming reversals or provide early warning signs of a change in market dynamics.
This indicator is particularly useful for futures traders who are looking to gain insights into the market structure and to exploit differences in contract pricing. By providing a clear visualization of the spread between two key futures contracts, traders can make more informed decisions about their trading strategies.
Description:
The FCNC Spread Indicator is designed to help traders analyze the price difference (spread) between two futures contracts: the front contract and the next contract. This type of analysis is commonly used in futures trading to identify market sentiment, arbitrage opportunities, and potential roll yield strategies.
How It Works:
Front Contract: The front contract represents the futures contract closest to expiration, often referred to as the near-month contract.
Next Contract: The next contract is the futures contract that follows the front contract in the expiration cycle, typically the next available month.
Spread Calculation: frontContract - nextContract represents the difference between the price of the front contract and the next contract.
Positive Spread: A positive value means that the front contract is more expensive than the next contract, indicating backwardation.
Negative Spread: A negative value means that the front contract is cheaper than the next contract, indicating contango.
How to Use:
Input Selection: Select your desired futures contracts for the front and next contract through the input settings. The script will fetch and calculate the closing prices of these contracts.
Spread Plotting: The calculated spread is plotted on the chart, with color-coding based on the spread's value (green for positive, red for negative).
Labeling: The spread value is dynamically labeled on the chart for quick reference.
Moving Average: A 20-period Simple Moving Average (SMA) of the spread is also plotted to help identify trends and smooth out fluctuations.
Applications:
Trend Identification: Analyze the spread to determine market sentiment and potential trend reversals.
Divergence Detection: Look for divergences between the spread and the underlying market to identify possible shifts in trend or market sentiment. Divergences can signal upcoming reversals or provide early warning signs of a change in market dynamics.
This indicator is particularly useful for futures traders who are looking to gain insights into the market structure and to exploit differences in contract pricing. By providing a clear visualization of the spread between two key futures contracts, traders can make more informed decisions about their trading strategies.
오픈 소스 스크립트
트레이딩뷰의 진정한 정신에 따라, 이 스크립트의 작성자는 이를 오픈소스로 공개하여 트레이더들이 기능을 검토하고 검증할 수 있도록 했습니다. 작성자에게 찬사를 보냅니다! 이 코드는 무료로 사용할 수 있지만, 코드를 재게시하는 경우 하우스 룰이 적용된다는 점을 기억하세요.
면책사항
해당 정보와 게시물은 금융, 투자, 트레이딩 또는 기타 유형의 조언이나 권장 사항으로 간주되지 않으며, 트레이딩뷰에서 제공하거나 보증하는 것이 아닙니다. 자세한 내용은 이용 약관을 참조하세요.
오픈 소스 스크립트
트레이딩뷰의 진정한 정신에 따라, 이 스크립트의 작성자는 이를 오픈소스로 공개하여 트레이더들이 기능을 검토하고 검증할 수 있도록 했습니다. 작성자에게 찬사를 보냅니다! 이 코드는 무료로 사용할 수 있지만, 코드를 재게시하는 경우 하우스 룰이 적용된다는 점을 기억하세요.
면책사항
해당 정보와 게시물은 금융, 투자, 트레이딩 또는 기타 유형의 조언이나 권장 사항으로 간주되지 않으며, 트레이딩뷰에서 제공하거나 보증하는 것이 아닙니다. 자세한 내용은 이용 약관을 참조하세요.