OPEN-SOURCE SCRIPT
Quarters Theory
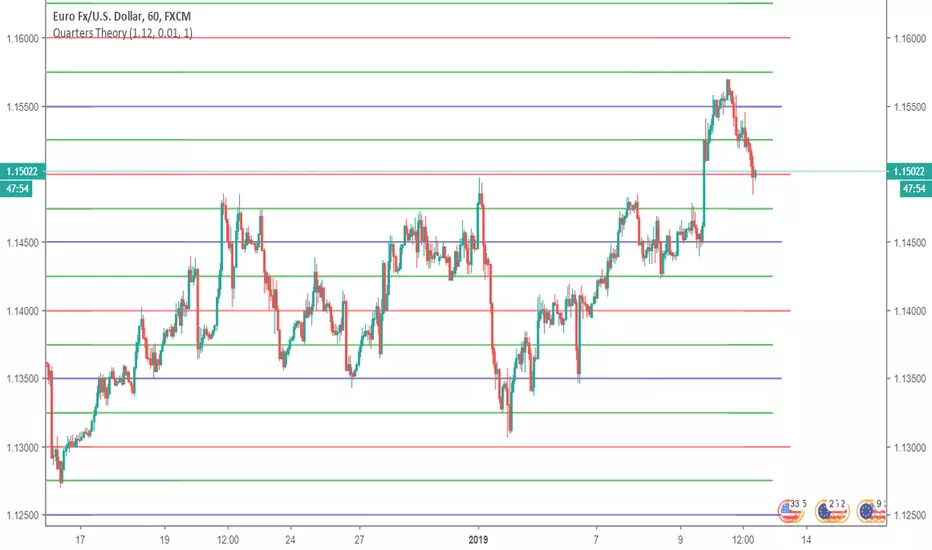
Indicator that lets you to put Whole (red), Half (blue) and Quarter (green) levels on a chart, which work as support/resistance levels. Defaults are only for EURUSD, for other symbols you have to change the settings. First input is "Starting Price (Bottom)", which should be the lowest point you want your levels to be. There are only 10 Whole levels on this indicator, but if you want you could add them from pine editor. The next input is "Next Whole Level" this is the price from one whole level to next whole level, for example for EURUSD it is 0.01. The third input is for removing the quarter lines (green lines), if you want to remove them set this option to "0", otherways leave this to "1".
This indicator looks very good on JPY and NZD pairs.


Works on long term too:

Learned from him: youtube.com/watch?v=QLrtBPtKPBA
This indicator looks very good on JPY and NZD pairs.
Works on long term too:
Learned from him: youtube.com/watch?v=QLrtBPtKPBA
오픈 소스 스크립트
트레이딩뷰의 진정한 정신에 따라, 이 스크립트의 작성자는 이를 오픈소스로 공개하여 트레이더들이 기능을 검토하고 검증할 수 있도록 했습니다. 작성자에게 찬사를 보냅니다! 이 코드는 무료로 사용할 수 있지만, 코드를 재게시하는 경우 하우스 룰이 적용된다는 점을 기억하세요.
면책사항
해당 정보와 게시물은 금융, 투자, 트레이딩 또는 기타 유형의 조언이나 권장 사항으로 간주되지 않으며, 트레이딩뷰에서 제공하거나 보증하는 것이 아닙니다. 자세한 내용은 이용 약관을 참조하세요.
오픈 소스 스크립트
트레이딩뷰의 진정한 정신에 따라, 이 스크립트의 작성자는 이를 오픈소스로 공개하여 트레이더들이 기능을 검토하고 검증할 수 있도록 했습니다. 작성자에게 찬사를 보냅니다! 이 코드는 무료로 사용할 수 있지만, 코드를 재게시하는 경우 하우스 룰이 적용된다는 점을 기억하세요.
면책사항
해당 정보와 게시물은 금융, 투자, 트레이딩 또는 기타 유형의 조언이나 권장 사항으로 간주되지 않으며, 트레이딩뷰에서 제공하거나 보증하는 것이 아닙니다. 자세한 내용은 이용 약관을 참조하세요.