INVITE-ONLY SCRIPT
FSVZO {DCAquant}
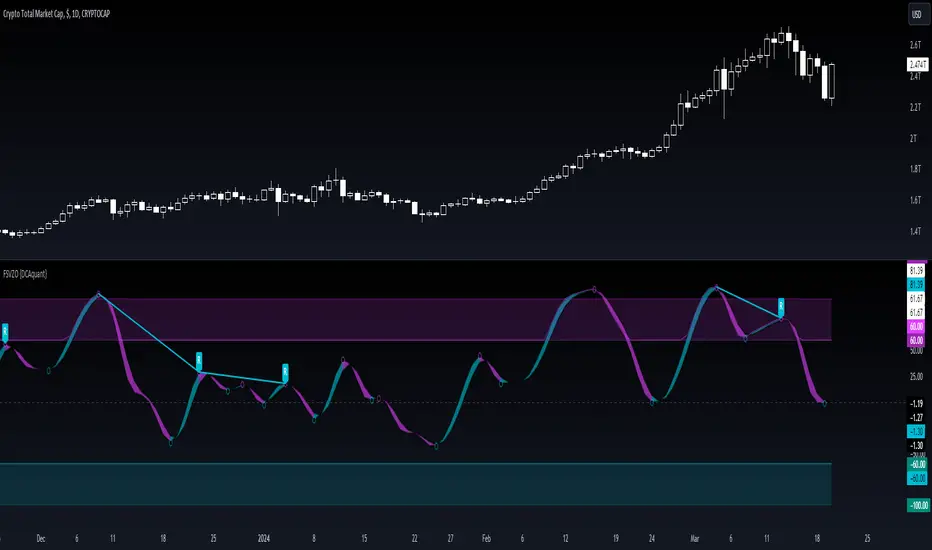
The Fourier Smoothed Volume Zone Oscillator (FSVZO) is an innovative technical indicator that leverages complex mathematical models to provide a multifaceted view of market dynamics. Designed as a closed-source script for TradingView, FSVZO employs Fourier analysis and the Augmented Dickey-Fuller (ADF) test to help traders identify and capitalize on potential market trends and reversals.
Key Features:
ADF Test Integration: Employs the statistical power of the ADF test to identify the stationarity within a time series, which can be pivotal for recognizing trend changes.
Advanced Mathematical Operations: Incorporates sophisticated computations like matrix manipulation and QR decomposition to refine the accuracy of market signals.
Fourier Transform Analysis: Utilizes Fourier Transform to distill market movements into a spectral view, revealing underlying cyclical patterns.
Dynamic Trend Visualization: Clearly marks trend shifts on the chart, assisting traders in visualizing and interpreting changes in market momentum.
Color-Coded Signals: Features dynamic color-coding that alerts traders to bullish (aqua) and bearish (fuchsia) market phases based on the oscillator's movement.
Interpretation and Usage:
Overbought/Oversold Conditions: The indicator demarcates overbought and oversold zones, which can signal potential reversals when the FSVZO line crosses these thresholds.
Directional Bias: A cross above or below the zero line indicates potential bullish or bearish trends, respectively, offering clear buy/sell signals.
Multi-Timeframe Analysis: The FSVZO's versatility allows for its application across different timeframes, providing consistent analysis from macro to micro perspectives.
Customization and Flexibility:
Traders can tailor the FSVZO settings to fit their unique trading approach, adjusting parameters like lookback periods and calculation sources for a personalized experience.
How to Use FSVZO {DCAquant} for Market Analysis:
The FSVZO {DCAquant} serves as a multi-dimensional tool that can enhance your trading strategy. Here's how to integrate it into your market analysis for spotting potential trend reversals and other trading signals:
Identify Market Phases:
Bullish Phases: Watch for the FSVZO line to turn aqua and move upward, particularly after being in an oversold region or crossing above the zero line.
Bearish Phases: Look for the FSVZO line to turn fuchsia and trend downward, especially if it descends from an overbought area or drops below the zero threshold.
Spotting Potential Reversals:
From Overbought/Oversold Levels: A reversal may be impending when the FSVZO exits the overbought or oversold regions, suggesting a saturation of the prevailing trend.
Pivot Points: The script marks pivot points with labels ("R" for regular and "H" for hidden divergences). These points, combined with divergence patterns, can signal a strong likelihood of a trend reversal.
Utilizing Divergences:
Regular Divergence: Occurs when the price records a higher high or lower low, but the FSVZO does not, indicating a weakening trend.
Hidden Divergence: When the price makes a lower high or higher low, but the FSVZO suggests continued strength, it could be an opportunity to join a trend continuation.
Confirming Trade Entries:
Enter a trade in the direction indicated by the FSVZO trend shift circles and confirm with additional analysis (e.g., candlestick patterns, support/resistance levels).
Setting Exit Points:
Set take-profit levels near identified pivot points or when the FSVZO line reaches the opposite overbought or oversold level.
Use trailing stops following the FSVZO line to capitalize on prolonged trends and protect against sudden reversals.
Multi-Timeframe Confluence:
Apply the FSVZO on multiple timeframes to find confluence. For instance, a bullish signal on both daily and hourly charts could increase the confidence in a long position.
Remember that the FSVZO {DCAquant} is best used as part of a comprehensive trading system. It is essential to consider volume, price action, and market context when interpreting signals. As with any technical tool, confirm FSVZO signals with other analysis methods to increase the probability of successful trades.
Educational Value:
FSVZO {DCAquant} is a powerful educational tool designed to enhance traders' understanding of the markets. It encourages comprehensive analysis and should be used in conjunction with robust risk management strategies.
Disclaimer:
While FSVZO {DCAquant} is developed to inform trading decisions with advanced data analysis, it does not guarantee accurate prediction of future market movements. Traders are advised to use this tool as part of a diversified strategy and perform due diligence before making trading decisions.
초대 전용 스크립트
이 스크립트는 작성자가 승인한 사용자만 접근할 수 있습니다. 사용하려면 요청 후 승인을 받아야 하며, 일반적으로 결제 후에 허가가 부여됩니다. 자세한 내용은 아래 작성자의 안내를 따르거나 DCAquant에게 직접 문의하세요.
트레이딩뷰는 스크립트의 작동 방식을 충분히 이해하고 작성자를 완전히 신뢰하지 않는 이상, 해당 스크립트에 비용을 지불하거나 사용하는 것을 권장하지 않습니다. 커뮤니티 스크립트에서 무료 오픈소스 대안을 찾아보실 수도 있습니다.
작성자 지시 사항
Please visit dcaquant.com or contact us directly via tradingview or info@dcaquant.com
면책사항
해당 정보와 게시물은 금융, 투자, 트레이딩 또는 기타 유형의 조언이나 권장 사항으로 간주되지 않으며, 트레이딩뷰에서 제공하거나 보증하는 것이 아닙니다. 자세한 내용은 이용 약관을 참조하세요.